Jan. 19 Lab
advertisement
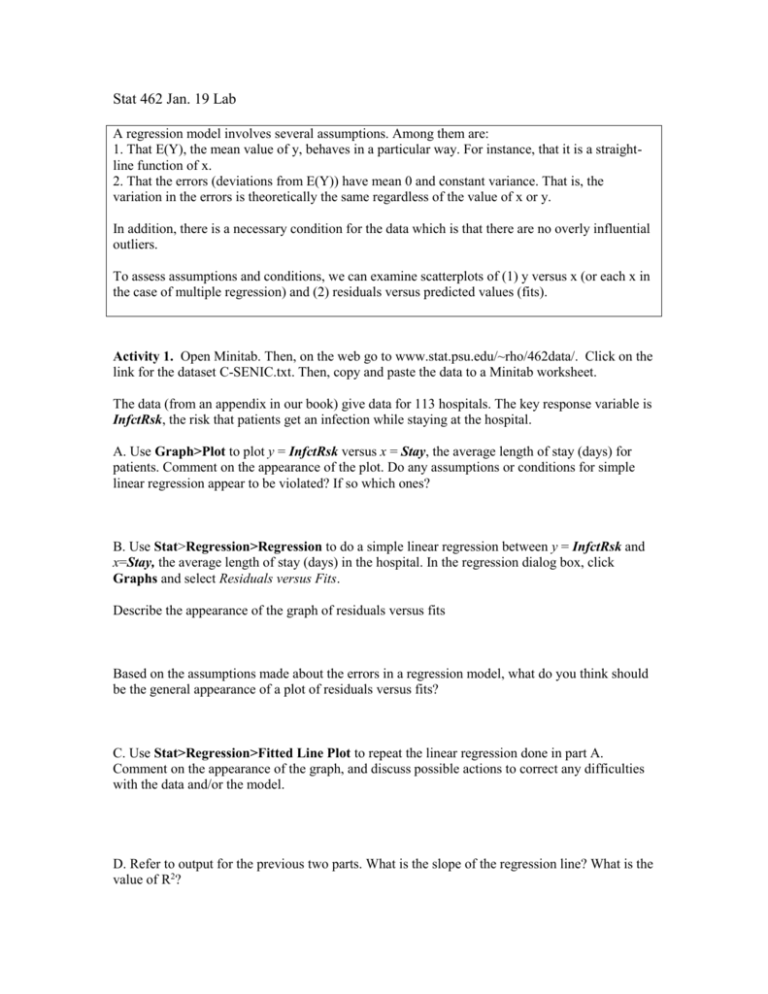
Stat 462 Jan. 19 Lab A regression model involves several assumptions. Among them are: 1. That E(Y), the mean value of y, behaves in a particular way. For instance, that it is a straightline function of x. 2. That the errors (deviations from E(Y)) have mean 0 and constant variance. That is, the variation in the errors is theoretically the same regardless of the value of x or y. In addition, there is a necessary condition for the data which is that there are no overly influential outliers. To assess assumptions and conditions, we can examine scatterplots of (1) y versus x (or each x in the case of multiple regression) and (2) residuals versus predicted values (fits). Activity 1. Open Minitab. Then, on the web go to www.stat.psu.edu/~rho/462data/. Click on the link for the dataset C-SENIC.txt. Then, copy and paste the data to a Minitab worksheet. The data (from an appendix in our book) give data for 113 hospitals. The key response variable is InfctRsk, the risk that patients get an infection while staying at the hospital. A. Use Graph>Plot to plot y = InfctRsk versus x = Stay, the average length of stay (days) for patients. Comment on the appearance of the plot. Do any assumptions or conditions for simple linear regression appear to be violated? If so which ones? B. Use Stat>Regression>Regression to do a simple linear regression between y = InfctRsk and x=Stay, the average length of stay (days) in the hospital. In the regression dialog box, click Graphs and select Residuals versus Fits. Describe the appearance of the graph of residuals versus fits Based on the assumptions made about the errors in a regression model, what do you think should be the general appearance of a plot of residuals versus fits? C. Use Stat>Regression>Fitted Line Plot to repeat the linear regression done in part A. Comment on the appearance of the graph, and discuss possible actions to correct any difficulties with the data and/or the model. D. Refer to output for the previous two parts. What is the slope of the regression line? What is the value of R2? E. Create a dataset that includes only observations with Stay<= 15. To do this, use Manip>Subset Worksheet, click the Condition button and set up the resulting calculator to show Stay <=15. Then, using this new dataset, fit a linear model to y = InfctRsk and x= Stay, and graph residuals versus fits for this model. What is the slope of the line? How does this slope compare to the slope reported in part D. What is the value of R2? How does this compare to the value reported in part D? Interpret the plot of residuals versus fits (for the “restricted” dataset). Activity 2. Return to the full dataset. Analyze the relationship between y = Nurses, the number of nurses at the hospital, and x = Services, a measure of services and facilities at the hospital. Use these steps: A. Graph y versus x. Comment on the appearance. B. Fit a simple regression model. Plot residuals versus fits. Using this graph and the graph of y versus x, comment on any violations of assumptions or conditions. C. Refer to the previous part. What value is given for the standard deviation from the regression line? For R2? C. Using Stat>Regression>Fitted Line Plot, fit a quadratic model. In the dialog box, there’s a radio button that can be used to select a quadratic model. Also, using the Storage button, store the residuals and fits. After getting output -Comment on the appearance of the quadratic fit. What is the prediction equation for the quadratic model? D. For the quadratic model, what value is given for the standard deviation from the regression line? For R2? How do these values compare to the corresponding values of the linear model? E. Using Graph>Plot, plot the residuals versus fits for the quadratic model. Comment on any possible violations of assumptions or necessary conditions.


