Reading Minitab output for a simple linear regression model
advertisement
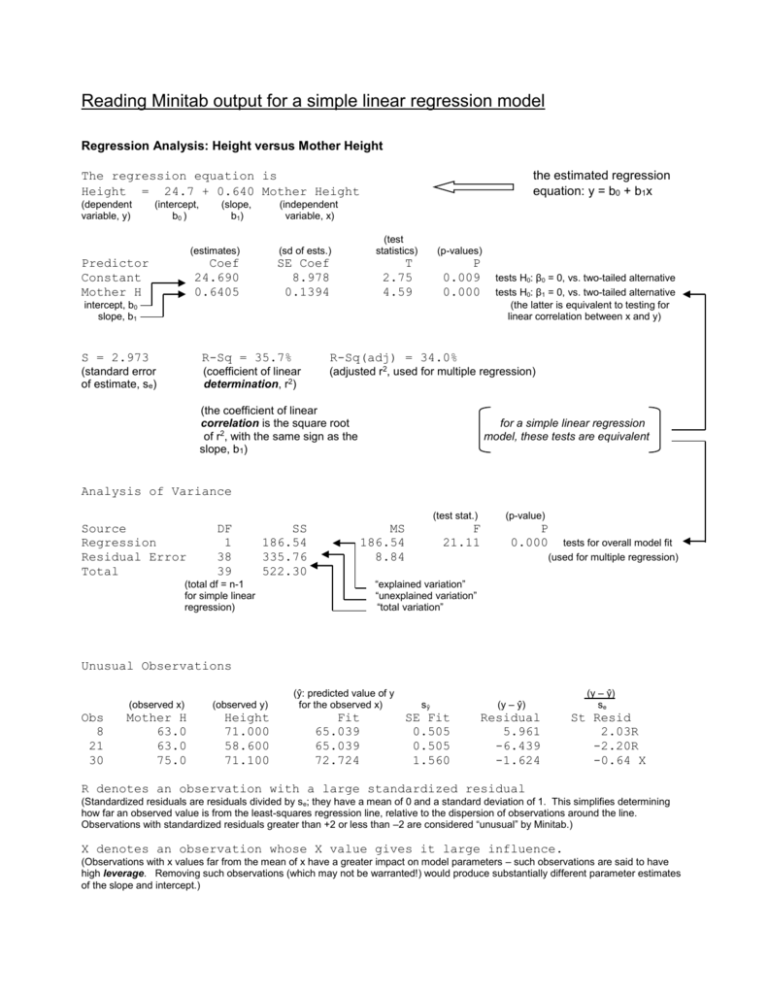
Reading Minitab output for a simple linear regression model Regression Analysis: Height versus Mother Height The regression equation is Height = 24.7 + 0.640 Mother Height (dependent variable, y) (intercept, b0 ) Predictor Constant Mother H (slope, b1) the estimated regression equation: y = b0 + b1x (independent variable, x) (estimates) (sd of ests.) (test statistics) (p-values) Coef 24.690 0.6405 SE Coef 8.978 0.1394 T 2.75 4.59 P 0.009 0.000 intercept, b0 slope, b1 tests H0: β0 = 0, vs. two-tailed alternative tests H0: β1 = 0, vs. two-tailed alternative (the latter is equivalent to testing for linear correlation between x and y) S = 2.973 R-Sq = 35.7% R-Sq(adj) = 34.0% (standard error of estimate, se) (coefficient of linear determination, r2) (adjusted r2, used for multiple regression) (the coefficient of linear correlation is the square root of r2, with the same sign as the slope, b1) for a simple linear regression model, these tests are equivalent Analysis of Variance (test stat.) Source Regression Residual Error Total DF 1 38 39 SS 186.54 335.76 522.30 MS 186.54 8.84 F 21.11 (p-value) P 0.000 tests for overall model fit (used for multiple regression) “explained variation” “unexplained variation” “total variation” (total df = n-1 for simple linear regression) Unusual Observations Obs 8 21 30 (observed x) (observed y) Mother H 63.0 63.0 75.0 Height 71.000 58.600 71.100 (ŷ: predicted value of y for the observed x) Fit 65.039 65.039 72.724 sŷ (y – ŷ) SE Fit 0.505 0.505 1.560 Residual 5.961 -6.439 -1.624 (y – ŷ) se St Resid 2.03R -2.20R -0.64 X R denotes an observation with a large standardized residual (Standardized residuals are residuals divided by se; they have a mean of 0 and a standard deviation of 1. This simplifies determining how far an observed value is from the least-squares regression line, relative to the dispersion of observations around the line. Observations with standardized residuals greater than +2 or less than –2 are considered “unusual” by Minitab.) X denotes an observation whose X value gives it large influence. (Observations with x values far from the mean of x have a greater impact on model parameters – such observations are said to have high leverage. Removing such observations (which may not be warranted!) would produce substantially different parameter estimates of the slope and intercept.)
