STT 825
advertisement
STT 825
F 01
Homework #3
Due Friday, October 12
1. (13 points) We took a simple random sample of 30 stores from a list of 290 stores. Data is given below
yi=sales, xi=number of employees in ith store. NOTE: tx = 2668.
y 73 57 73 41 42 40 52 28 82 58 56 68 66 75 72 51 39 45 39 36 77 36 55 50 73 64 33 67 49 82
x 17 11 14 07 05 03 10 05 17 09 06 15 15 17 17 05 04 04 07 03 18 03 09 05 15 13 04 16 07 15
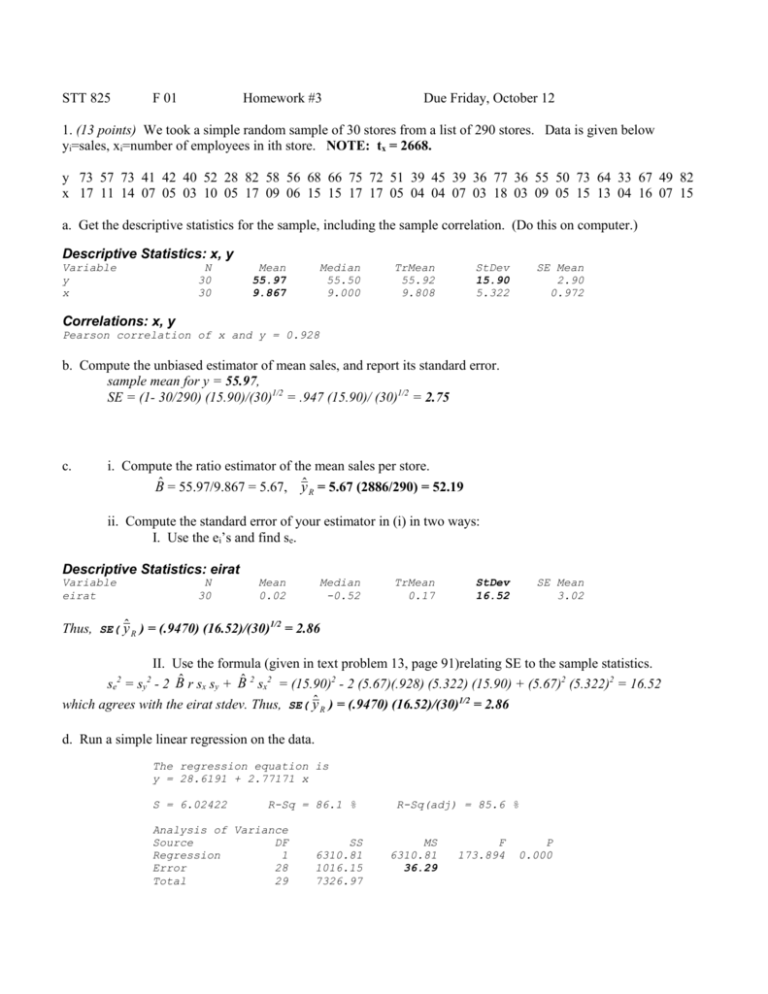
a. Get the descriptive statistics for the sample, including the sample correlation. (Do this on computer.)
Descriptive Statistics: x, y
Variable
y
x
N
30
30
Mean
55.97
9.867
Median
55.50
9.000
TrMean
55.92
9.808
StDev
15.90
5.322
SE Mean
2.90
0.972
Correlations: x, y
Pearson correlation of x and y = 0.928
b. Compute the unbiased estimator of mean sales, and report its standard error.
sample mean for y = 55.97,
SE = (1- 30/290) (15.90)/(30)1/2 = .947 (15.90)/ (30)1/2 = 2.75
c.
i. Compute the ratio estimator of the mean sales per store.
B̂ = 55.97/9.867 = 5.67, ŷ R = 5.67 (2886/290) = 52.19
ii. Compute the standard error of your estimator in (i) in two ways:
I. Use the ei’s and find se.
Descriptive Statistics: eirat
Variable
eirat
N
30
Mean
0.02
Median
-0.52
TrMean
0.17
StDev
16.52
SE Mean
3.02
Thus, SE( ŷ R ) = (.9470) (16.52)/(30)1/2 = 2.86
II. Use the formula (given in text problem 13, page 91)relating SE to the sample statistics.
se = sy - 2 B̂ r sx sy + B̂ 2 sx2 = (15.90)2 - 2 (5.67)(.928) (5.322) (15.90) + (5.67)2 (5.322)2 = 16.52
2
2
which agrees with the eirat stdev. Thus, SE( ŷ R ) = (.9470) (16.52)/(30)1/2 = 2.86
d. Run a simple linear regression on the data.
The regression equation is
y = 28.6191 + 2.77171 x
S = 6.02422
R-Sq = 86.1 %
Analysis of Variance
Source
DF
Regression
1
Error
28
Total
29
SS
6310.81
1016.15
7326.97
R-Sq(adj) = 85.6 %
MS
6310.81
36.29
F
173.894
P
0.000
i. Report the regression function.
y = 28.6191 + 2.77171x (rounding off is o.k.)
ii. Find the regression estimator of the mean sales.
55.97 + (2.77)(9.2 - 9.867) = 54.12
iii. Use the regression output to find se2 for the regression estimator, and then compute the standard error
of your estimator in (ii).
Descriptive Statistics: eireg
Variable
eireg
N
30
Mean
-0.00
Median
-0.72
TrMean
0.04
StDev
5.92
= se
SE Mean
1.08
or obtain se2 = (n-2) MSE/(n-1) = (28)(36.29)/(29) = 35.04 which gives se = 5.92.
Thus, SE for the regression estimator is (.947) (5.92)/ (30)1/2 =1.024.
e. Which estimator (unbiased, ratio, regression) would you recommend?
The regression estimator does very well. The ratio estimator is the worst because the data (x,y) doesn’t fit
a line through the origin very well.
f. In the sample, we recorded the number of employees at each store. If we didn’t know such information before
sampling, could be stratify by number of employees at a store? Why or why not?
No, you have to know which stratum a store is in and the stratum sizes before you sample.
----------------------------------------------------------------------------------------------------------------------------------------2. (3 points) We took a simple random sample of 300 students from a population of 500 students and measured
the amount spent on textbooks and the student’s college. Summary statistics are given below:
Sample of all students
Social Science Students in the sample
Number
300
72
Mean amount spent
$387.20
$301.15
Standard Deviation
$67.40
$61.20
a. Estimate the mean amount spent on text books for social science students and report its standard error.
mean = $301.15,
SE = (1- n/N)1/2 sd/ (n1/2) = .6325 (61.2) / (72)1/2 = 4.56
b. Is the number of students in social science in the sample random or fixed?
random
c. Is the group of social science students a domain or a stratum?
Domain
----------------------------------------------------------------------------------------------------------------------------------------3. (5 points) Consider a simplified version of problem #3, Exam 1. Suppose we have 50 flats of up to 6
plants each.
a. A simple random sample of 4 labels will be taken from labels {1,2,…,50}. Suppose that Flat #50 was
too damaged to use, but all the others were fine to use. If Flat #50 was selected, the technician would just take Flat
#49 instead. Show this is NOT an SRS of {1,2,…,49} by giving two units that have unequal chances of being
in the sample.
#49 has a greater chance of being in the sample than #1,…, or #48. At STAGE 1, the chance of selecting #49 =
2/50 while the chance of selecting, say, #1 is 1/50.
b. Now assume no damaged flats, and suppose we sampled every 10th flat in the list of 50 (giving a sample of size
5), but started the selection at random.
i. Show this is not an SRS by finding a sample which is possible under SRS but not possible under this
scheme.
Any non-systematic sample of size 5 such as {1,2,3,4,5}.
ii. Find the sampling weight of Unit #1.
= 1/P(Unit #1 is selected) = 50/5 = 10.
c. Suppose we decided to sample plants rather than flats. Select a simple random sample of 3 flats, then select 2
plants at random from each selected flat. (Assume no damaged flats and at least 2 plants per flat.)
i. Show this is not an SRS by finding a sample which is possible under SRS but not possible under this
scheme.
Any sample containing more than 2 plants from one flat is impossible.
ii. Is this Stratified Random Sampling?
NO
d. Again, we will sample plants. Suppose we select 2 plants at random from each of the 50 flats (thus getting a
sample of 100 plants). What kind of sampling is this? (Assume no damanged flats and at 2 plants per flat.)
[SRS
Stratified Random Sampling
Systematic Samping
none of these]]
----------------------------------------------------------------------------------------------------------------------------------------4. (7 points) Do text problem 3a (Do not do 3b), Chapter 4. Use stratum sizes 5713, 1272, 1288, 5072
which are computed by Area/.039.
Data Display
Row
capNh
nh
ybar_h
vhat_h
that_h
Vt_hat_h
t_hat
v_hat
1
2
3
4
5713
1272
1288
5072
4
6
3
5
0.44
1.17
3.92
1.80
0.068
0.042
2.146
0.794
2513.72
1488.24
5048.96
9129.60
554464
11272
1183934
4081132
18180.5
5830802
Estimate the total number of bushels of clams as 18,180.5,
SE = (5830802)1/2 =2417.7
Also answer the following questions:
b. What are the sampling units?
tows
c. What is the sampling weight for a tow in stratum #4?
N4/n4 = 5072/5 = 1014.4
d. Compute a 95% t-confidence interval for the total yield.
18180.5 t025;14 (2417.7) which is 18180.5 (2.145) (2417.7) which is 18180.5 5186.0
e. Comment on use of the t in part (e).
The total sample size is only 18 and the stratum sample size are quite small. Question the
validity of the confidence level reported in (d).
--------------------------------------------------------------------------------------------------------------------------5. (8points) We have a population of 500 accounts, stratified by balance of the account:
Stratum 1: balance $0 up to $500
Stratum 2: balance $500 up to $2000
Stratum 3: balance $2000 and up.
Yesterday's fees were measured on all accounts, and population characteristics are
Stratum number of accounts
mean fee
standard deviation
1
150
$2.05
$2.07
2
300
$3.93
$2.75
3
50
$8.22
$4.03
population
500
$ (a) below
$3.21
a.
i. Find the mean fee for all 500 accounts.
= wtd average of the stratum means = 3.789 or 3.80 is o.k. (this is a population mean)
ii. Find the total fees for all 500 accounts.
500 x your answer in (i) = 500 (3.789) = 1894.5 or 1900 is o.k.
b.
i. Give proportional allocation of a sample of n=100 accounts.
h
Nh/N
nh
1
150/500 = .3 30
2
300/500 = .6 60
3
50/500 = .1
10
ii. Compute the V [tˆstr ] .
h
(1-nh/Nh) Nh2 Sh2 / nh
1
2
3
sum
2570.6
9075
3248.2
= V [tˆstr ] = 14,894 (there may be some rounding error)
iii. Give the sampling weight for an observation from Stratum #1.
N1/n1 = 150/30 = 5
c.
i. For a simple random sample of size 100, compute V [tˆ] .
(1 - 100/500) (500)2 (3.21)2 / 100 = 20,608.2
ii. Give the sampling weight for an observation from Stratum #1.
N/n = 500/100 = 5
-----------------------------------------------------------------------------------------------------------------------------------------6. (12 points) Do text problem 10, Chapter 4.
a. Convert the data back to the “raw” form:
Stratum 1: observations 0,1,1,3,5,5,7,
Likewise, for the other stata.
Then compute the descriptive statistics by stratum.
Stratum
1
2
3
4
nh
7
19
13
11
Mean
3.143
2.105
1.231
0.455
sh
2.610
2.865
2.088
0.934
tˆh
320.586
652.55
267.127
80.99
1321.25
Vˆ[tˆh ]
9429.9
38944.6
14845.9
2357.4
65,577.8
Estimated total is 1321.25 (or 1321), SE of the estimated total is (65,577.8)1/2 = 256.1
b. SRS: estimated total = 1436.46, SE of estimated total = 296.2 The estimated total is lower for the
stratified sample and the SE is lower for the stratified sample (better precision).
c. This uses proportions.
Stratum
p̂ h
1
1/7 = .143
2
10/19=.526
3
9/13=.692
4
8/11=.727
Nh p̂ h
Vˆ[ pˆ h ]
14.57
.0003037
163.16
.0019185
150.23
.0012066
129.45
.0009053
457.415
.0043342
The estimated proportion = 457.415/807 = .57, its SE = (.0043342)1/2 = .0658
d. Yes (comparing (a) and (b)). Also, the number of publications seems to be affected by area.
------------------------------------------------------------------------------------------------------------------------------7. (2 points) Refer to text problem 15, Chapter 4. We did part (a) in class. Answer part (b).
b. Selection Bias:
+There may be otter dens with buildings (these strips were omitted from the sampled population.
+Only going 110 meters from the shore, may get dens further back.
(may be others)
Measurement Bias:
+Dens may be difficult to find (missed in the count).
+ Weather may affect ability to count dens
(may be others)
No - doubt if it’s possible to avoid all selection and measurement bias.
