Statistics – Introduction
advertisement
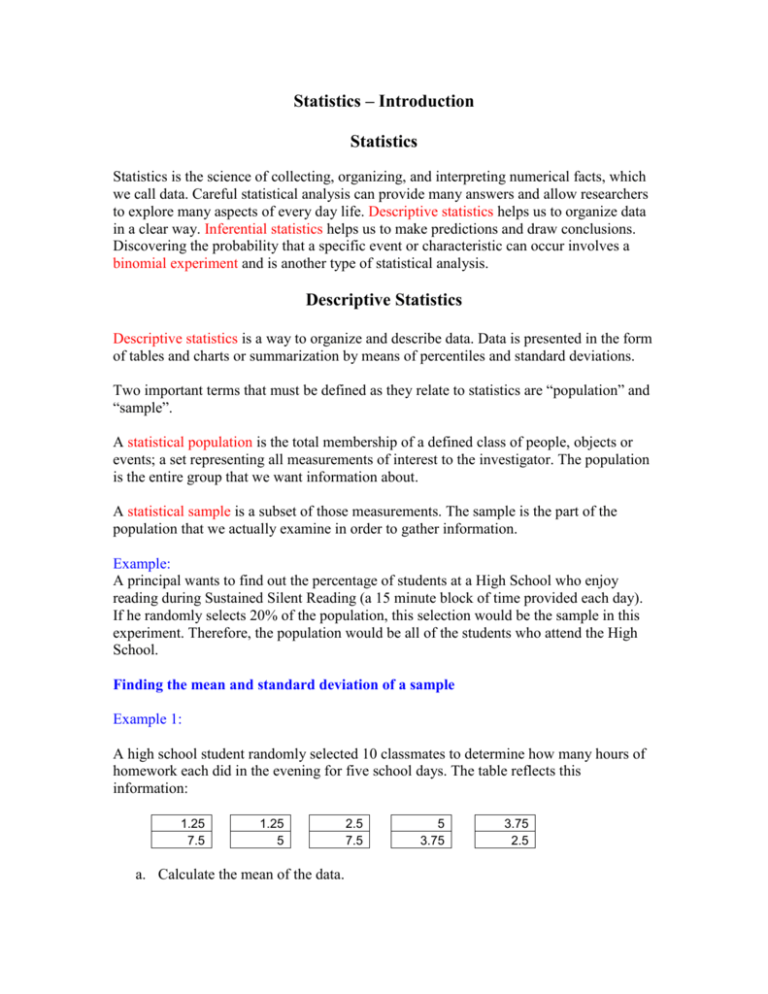
Statistics – Introduction Statistics Statistics is the science of collecting, organizing, and interpreting numerical facts, which we call data. Careful statistical analysis can provide many answers and allow researchers to explore many aspects of every day life. Descriptive statistics helps us to organize data in a clear way. Inferential statistics helps us to make predictions and draw conclusions. Discovering the probability that a specific event or characteristic can occur involves a binomial experiment and is another type of statistical analysis. Descriptive Statistics Descriptive statistics is a way to organize and describe data. Data is presented in the form of tables and charts or summarization by means of percentiles and standard deviations. Two important terms that must be defined as they relate to statistics are “population” and “sample”. A statistical population is the total membership of a defined class of people, objects or events; a set representing all measurements of interest to the investigator. The population is the entire group that we want information about. A statistical sample is a subset of those measurements. The sample is the part of the population that we actually examine in order to gather information. Example: A principal wants to find out the percentage of students at a High School who enjoy reading during Sustained Silent Reading (a 15 minute block of time provided each day). If he randomly selects 20% of the population, this selection would be the sample in this experiment. Therefore, the population would be all of the students who attend the High School. Finding the mean and standard deviation of a sample Example 1: A high school student randomly selected 10 classmates to determine how many hours of homework each did in the evening for five school days. The table reflects this information: 1.25 7.5 1.25 5 a. Calculate the mean of the data. 2.5 7.5 5 3.75 3.75 2.5 b. Determine the standard deviation for the data. Solution 1: a) = 1.25 + 1.25 + 2.5 + 5 + 3.75 + 7.5 + 5 + 7.5 + 3.75 + 2.5 10 = 4 b) Use a table to organize information: Sx = Sx = 2.27
