Random Rectangles Activity
advertisement
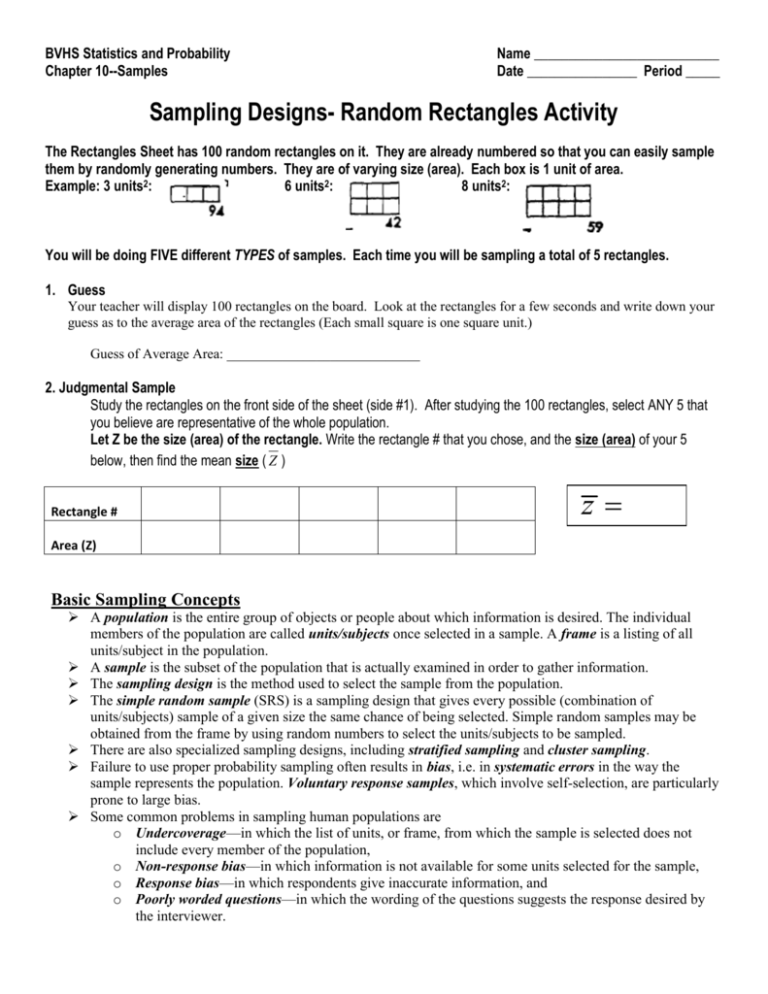
BVHS Statistics and Probability Chapter 10--Samples Name ___________________________ Date ________________ Period _____ Sampling Designs- Random Rectangles Activity The Rectangles Sheet has 100 random rectangles on it. They are already numbered so that you can easily sample them by randomly generating numbers. They are of varying size (area). Each box is 1 unit of area. Example: 3 units2: 6 units2: 8 units2: You will be doing FIVE different TYPES of samples. Each time you will be sampling a total of 5 rectangles. 1. Guess Your teacher will display 100 rectangles on the board. Look at the rectangles for a few seconds and write down your guess as to the average area of the rectangles (Each small square is one square unit.) Guess of Average Area: ____________________________ 2. Judgmental Sample Study the rectangles on the front side of the sheet (side #1). After studying the 100 rectangles, select ANY 5 that you believe are representative of the whole population. Let Z be the size (area) of the rectangle. Write the rectangle # that you chose, and the size (area) of your 5 below, then find the mean size ( Z ) Rectangle # z Area (Z) Basic Sampling Concepts A population is the entire group of objects or people about which information is desired. The individual members of the population are called units/subjects once selected in a sample. A frame is a listing of all units/subject in the population. A sample is the subset of the population that is actually examined in order to gather information. The sampling design is the method used to select the sample from the population. The simple random sample (SRS) is a sampling design that gives every possible (combination of units/subjects) sample of a given size the same chance of being selected. Simple random samples may be obtained from the frame by using random numbers to select the units/subjects to be sampled. There are also specialized sampling designs, including stratified sampling and cluster sampling. Failure to use proper probability sampling often results in bias, i.e. in systematic errors in the way the sample represents the population. Voluntary response samples, which involve self-selection, are particularly prone to large bias. Some common problems in sampling human populations are o Undercoverage—in which the list of units, or frame, from which the sample is selected does not include every member of the population, o Non-response bias—in which information is not available for some units selected for the sample, o Response bias—in which respondents give inaccurate information, and o Poorly worded questions—in which the wording of the questions suggests the response desired by the interviewer. 3. Simple Random Sample (SRS) Using the calculator, generate 5 random numbers from 1 to 100 (use randInt(1, 100)). Find the matching rectangle and its size. Record the info below, then find the mean. z Rectangle # Area (Z) 4. Stratified Sample On the back side of the rectangles, the rectangles have been separated into 5 groups (strata) based on size. Each strata now has 20 rectangles of similar size. We want to take a sample in each strata, then combine these to make our total sample. Generate a random number between 1 and 20 (randInt(1,20)), and use that rectangle in Strata #1. Record the # you generated and rectangle size below. Then do the same thing for each of the other strata (generate a new random number between 1 & 20 each time). Record the sizes and find the mean. Strata 1 Strata 2 Strata 3 Strata 4 Strata 5 z Rectangle # Area (Z) A potential advantage of stratified sampling is a more precise estimate of the population mean, μ, than one could find from a simple random sample (SRS) of the same size. This occurs because the stratified sampling reduces the sampling variability since samples taken with a stratum vary less, so our estimates can be more precise. Potential disadvantages are [1] the sampling procedure may be more difficult, because one needs to divide the population into strata before sampling, and [2] the formula for variance is more complicated. 5. Systematic Sample Use the original sheet of rectangles (side #1). Randomly generate a number between 1 and 20. This is the first rectangle you will sample. Write this rectangle # in the first box below. Add 20 to the random number to get the second rectangle you will sample. Continue to add 20 to get the next three rectangles for your sample. This is like having to sample every 20th person who passes you. Ex: You get the random number 6. Then you would inspect rectangles 6, 26, 46, 66, and 86. Record the rectangle numbers, sizes, and then find the mean size. Random Number Rectangle # Area (Z) r z 6. Cluster Sample Here we want to take a sample of a group of rectangles that are near each other. We still want a sample of five rectangles total, and we also still want it to be a random sample. Look back at the original sheet of rectangles (side #1). We can put the rectangles into clusters (groups) of five based on their assigned number. So the first cluster would be rectangles #1-5, the second cluster would be rectangles #6-10, and so on giving us 20 clusters to sample. Let’s choose a cluster for our sample. To do this, choose a random number, r, between 1 and 20. This is the cluster you will use for your sample. Now calculate 5r – 4 , and then 5r. The rectangles with numbers from 5r – 4 to 5r are your cluster. This should be 5 rectangles. Ex: You get the random number 6. 5(6) – 4 = 26 and 5(6) = 30. So this means you look at rectangles #26 – 30. Record the 5 rectangle numbers below, then their size, then the mean. Random Number r z Rectangle # Area (Z) A potential advantage of cluster sampling is its convenience. It may be difficult to find a simple random sample of organisms that are clustered. Potential disadvantages are [1] the units in a cluster may be similar, which leads to a loss of efficiency (i.e. we would need to sample more units to get same level of precision as with SRS, and [2] the formula for variance is more complicated. RECORD the data from your fellow classmates in the table given below. Guesses Judgemental SRS Stratified Systematic Cluster Compare sampling distributions 1. Sketch a dotplot of the class means from Judgmental sampling, SRS, Stratified sampling, Systematic sampling, and Cluster sampling. Guess 2. Discuss similarities and differences regarding shapes and spreads of each dot plot above. 3. Calculate the mean of the sample averages for the guess, judgemental sample and all of the other sampling techniques. Mark this value on each of the dot plots with a star symbol. How do these CENTERS of the distributions of the means compare? 4. Which method do you is the least accurate? Why? 5. Do you think one method is doing a better job? Why? 6. Sampling bias--The actual mean is 7.42. a. Do any of the plots have a center that is very close to the true average? If so, which one(s)? b. Do any of the plots have a center that is larger than the true average? If so, which one(s)? c. Which of the sampling strategies are most biased? Explain your answer.
