Measures of center, spread, comparison of distributions on Minitab
advertisement
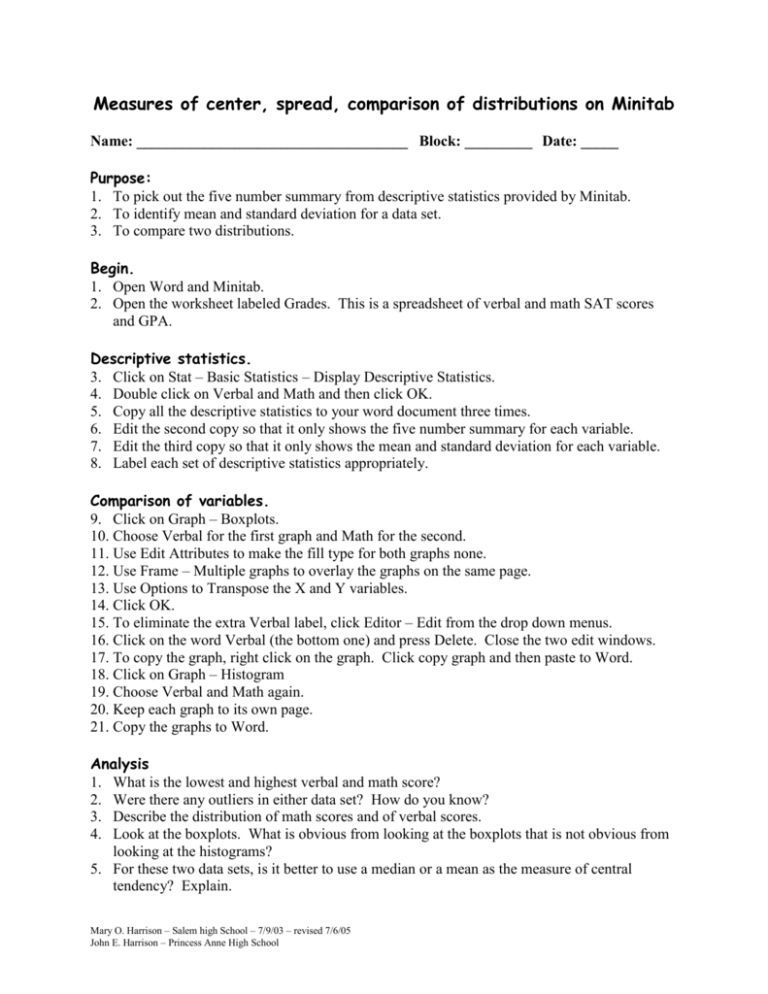
Measures of center, spread, comparison of distributions on Minitab Name: ____________________________________ Block: _________ Date: _____ Purpose: 1. To pick out the five number summary from descriptive statistics provided by Minitab. 2. To identify mean and standard deviation for a data set. 3. To compare two distributions. Begin. 1. Open Word and Minitab. 2. Open the worksheet labeled Grades. This is a spreadsheet of verbal and math SAT scores and GPA. Descriptive statistics. 3. Click on Stat – Basic Statistics – Display Descriptive Statistics. 4. Double click on Verbal and Math and then click OK. 5. Copy all the descriptive statistics to your word document three times. 6. Edit the second copy so that it only shows the five number summary for each variable. 7. Edit the third copy so that it only shows the mean and standard deviation for each variable. 8. Label each set of descriptive statistics appropriately. Comparison of variables. 9. Click on Graph – Boxplots. 10. Choose Verbal for the first graph and Math for the second. 11. Use Edit Attributes to make the fill type for both graphs none. 12. Use Frame – Multiple graphs to overlay the graphs on the same page. 13. Use Options to Transpose the X and Y variables. 14. Click OK. 15. To eliminate the extra Verbal label, click Editor – Edit from the drop down menus. 16. Click on the word Verbal (the bottom one) and press Delete. Close the two edit windows. 17. To copy the graph, right click on the graph. Click copy graph and then paste to Word. 18. Click on Graph – Histogram 19. Choose Verbal and Math again. 20. Keep each graph to its own page. 21. Copy the graphs to Word. Analysis 1. What is the lowest and highest verbal and math score? 2. Were there any outliers in either data set? How do you know? 3. Describe the distribution of math scores and of verbal scores. 4. Look at the boxplots. What is obvious from looking at the boxplots that is not obvious from looking at the histograms? 5. For these two data sets, is it better to use a median or a mean as the measure of central tendency? Explain. Mary O. Harrison – Salem high School – 7/9/03 – revised 7/6/05 John E. Harrison – Princess Anne High School

