Solutions to HW #3
advertisement
Solutions to HW #3
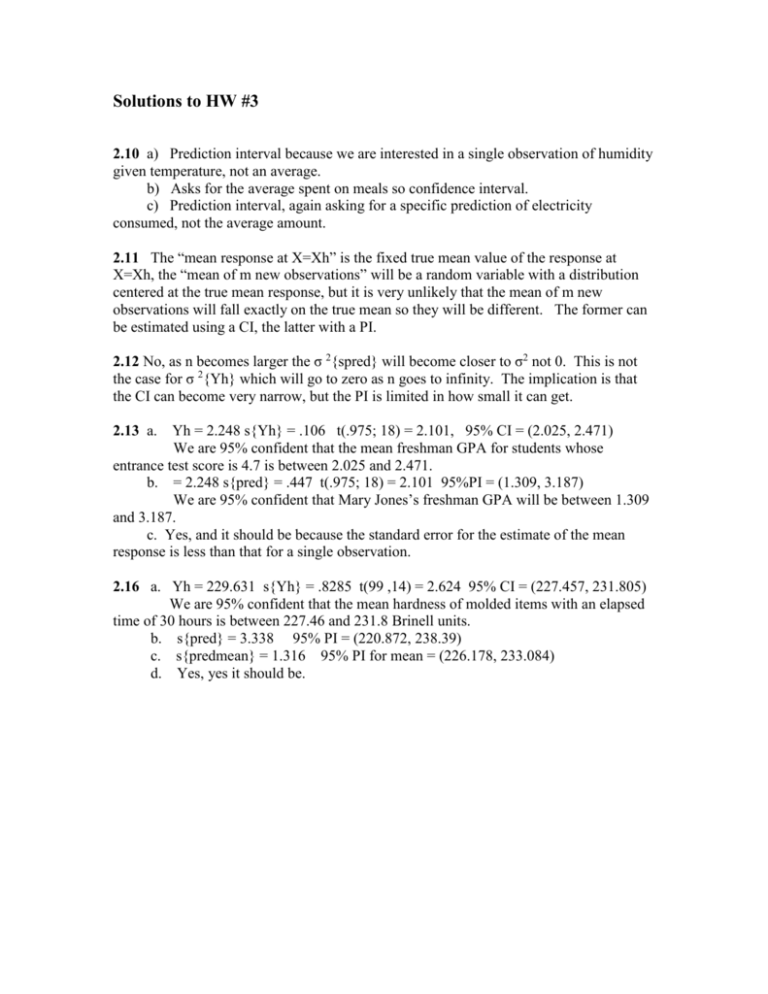
2.10 a) Prediction interval because we are interested in a single observation of humidity
given temperature, not an average.
b) Asks for the average spent on meals so confidence interval.
c) Prediction interval, again asking for a specific prediction of electricity
consumed, not the average amount.
2.11 The “mean response at X=Xh” is the fixed true mean value of the response at
X=Xh, the “mean of m new observations” will be a random variable with a distribution
centered at the true mean response, but it is very unlikely that the mean of m new
observations will fall exactly on the true mean so they will be different. The former can
be estimated using a CI, the latter with a PI.
2.12 No, as n becomes larger the σ 2{spred} will become closer to σ2 not 0. This is not
the case for σ 2{Yh} which will go to zero as n goes to infinity. The implication is that
the CI can become very narrow, but the PI is limited in how small it can get.
2.13 a.
Yh = 2.248 s{Yh} = .106 t(.975; 18) = 2.101, 95% CI = (2.025, 2.471)
We are 95% confident that the mean freshman GPA for students whose
entrance test score is 4.7 is between 2.025 and 2.471.
b. = 2.248 s{pred} = .447 t(.975; 18) = 2.101 95%PI = (1.309, 3.187)
We are 95% confident that Mary Jones’s freshman GPA will be between 1.309
and 3.187.
c. Yes, and it should be because the standard error for the estimate of the mean
response is less than that for a single observation.
2.16 a. Yh = 229.631 s{Yh} = .8285 t(99 ,14) = 2.624 95% CI = (227.457, 231.805)
We are 95% confident that the mean hardness of molded items with an elapsed
time of 30 hours is between 227.46 and 231.8 Brinell units.
b. s{pred} = 3.338 95% PI = (220.872, 238.39)
c. s{predmean} = 1.316 95% PI for mean = (226.178, 233.084)
d. Yes, yes it should be.
