Venn Diagrams & Probability: Examples & Practice
advertisement

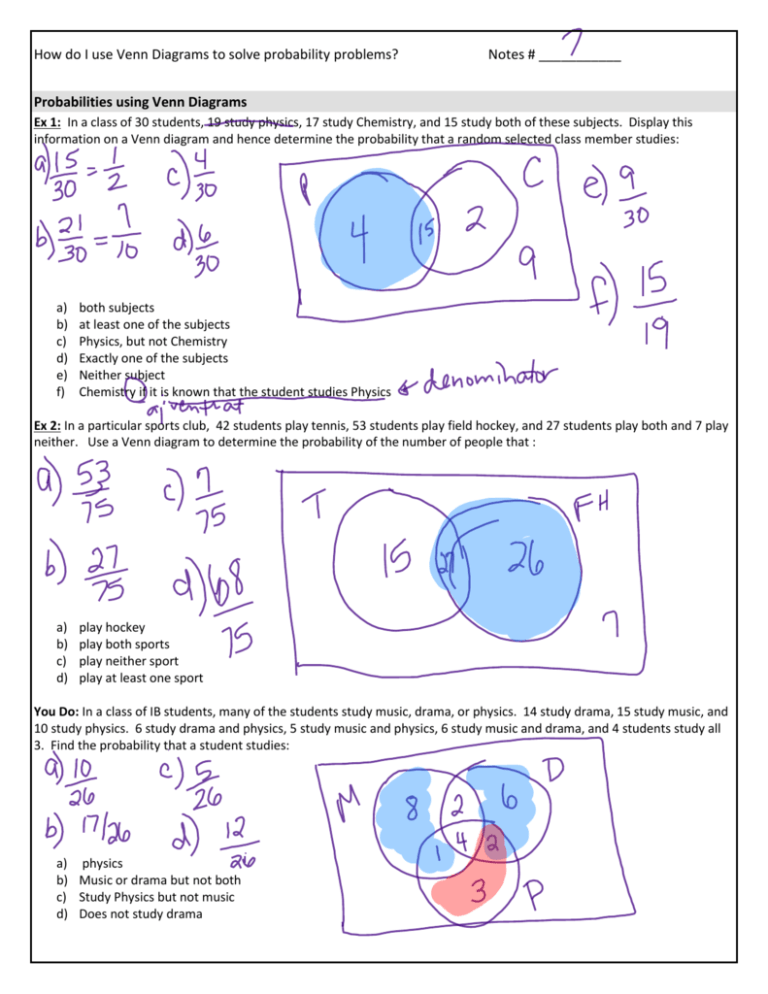
How do I use Venn Diagrams to solve probability problems? Notes # ___________ Probabilities using Venn Diagrams Ex 1: In a class of 30 students, 19 study physics, 17 study Chemistry, and 15 study both of these subjects. Display this information on a Venn diagram and hence determine the probability that a random selected class member studies: a) b) c) d) e) f) both subjects at least one of the subjects Physics, but not Chemistry Exactly one of the subjects Neither subject Chemistry if it is known that the student studies Physics Ex 2: In a particular sports club, 42 students play tennis, 53 students play field hockey, and 27 students play both and 7 play neither. Use a Venn diagram to determine the probability of the number of people that : a) b) c) d) play hockey play both sports play neither sport play at least one sport You Do: In a class of IB students, many of the students study music, drama, or physics. 14 study drama, 15 study music, and 10 study physics. 6 study drama and physics, 5 study music and physics, 6 study music and drama, and 4 students study all 3. Find the probability that a student studies: a) physics b) Music or drama but not both c) Study Physics but not music d) Does not study drama


