PROC REPORT
advertisement
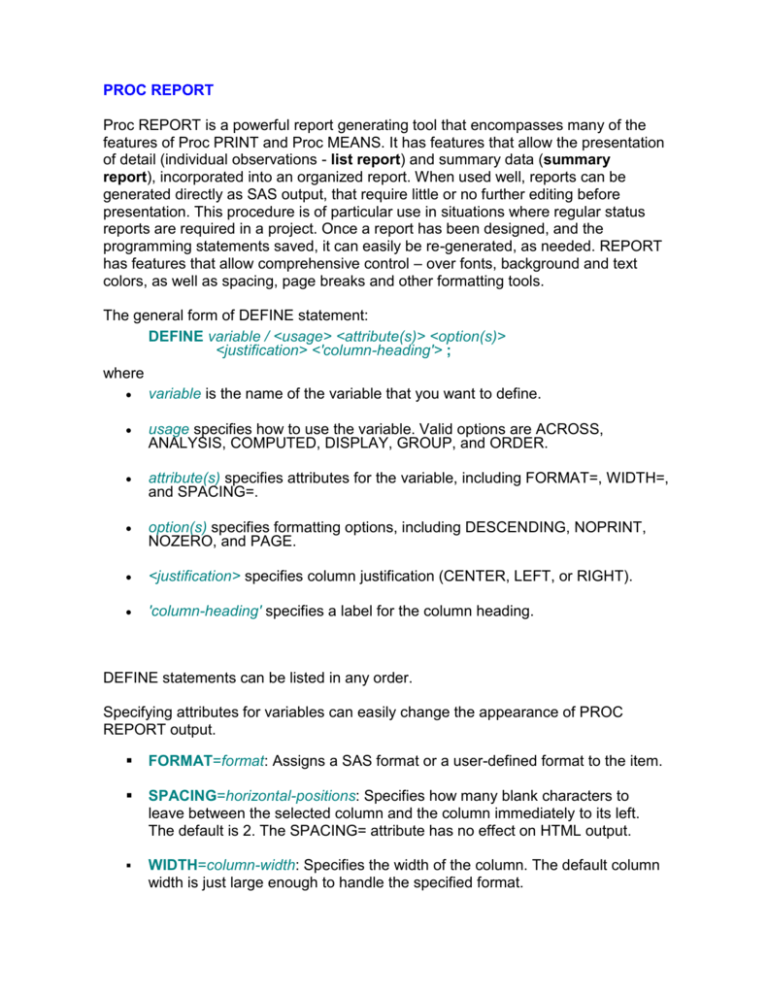
PROC REPORT Proc REPORT is a powerful report generating tool that encompasses many of the features of Proc PRINT and Proc MEANS. It has features that allow the presentation of detail (individual observations - list report) and summary data (summary report), incorporated into an organized report. When used well, reports can be generated directly as SAS output, that require little or no further editing before presentation. This procedure is of particular use in situations where regular status reports are required in a project. Once a report has been designed, and the programming statements saved, it can easily be re-generated, as needed. REPORT has features that allow comprehensive control – over fonts, background and text colors, as well as spacing, page breaks and other formatting tools. The general form of DEFINE statement: DEFINE variable / <usage> <attribute(s)> <option(s)> <justification> <'column-heading'> ; where variable is the name of the variable that you want to define. usage specifies how to use the variable. Valid options are ACROSS, ANALYSIS, COMPUTED, DISPLAY, GROUP, and ORDER. attribute(s) specifies attributes for the variable, including FORMAT=, WIDTH=, and SPACING=. option(s) specifies formatting options, including DESCENDING, NOPRINT, NOZERO, and PAGE. <justification> specifies column justification (CENTER, LEFT, or RIGHT). 'column-heading' specifies a label for the column heading. DEFINE statements can be listed in any order. Specifying attributes for variables can easily change the appearance of PROC REPORT output. FORMAT=format: Assigns a SAS format or a user-defined format to the item. SPACING=horizontal-positions: Specifies how many blank characters to leave between the selected column and the column immediately to its left. The default is 2. The SPACING= attribute has no effect on HTML output. WIDTH=column-width: Specifies the width of the column. The default column width is just large enough to handle the specified format. Options (usages, attributes, and so on) can also be listed in any order in a DEFINE statement. Planning the desired layout of a list / summary report is key to learning to use REPORT well. A report’s layout is determined in great part by the designation of variables into various categories. For each variable to appears in a report, a DEFINE statement is used to designate the display category for the report: DISPLAY – A row appears for every observation for variables with this designation. By default, all character are considered DISPLAY variables, unless another designation is given. ORDER – A row appears for every observation for variables with this designation, as a display variable, but this designation will order by value. GROUP – This designation groups on variable values to determine rows in the report, similar to using a CLASS variable in other procedures. ACROSS – Variables with this designation determine columns for the report – one for each distinct value of the variable present in the input data. ACROSS variables are comparable to CLASS variables in other procedures, but used to define columns in PROC REPORT. ANALYSIS – By default, PROC REPORT uses numeric variables as analysis variables, which are used for computation of summary statistics (the default SUM), for each cell of a report produced by ACROSS or by GROUP designations. COMPUTED - Defines the selected item as a computed variable. Computed variables are variables that you define for the report. They are not in the input data set, and PROC REPORT does not add them to the input data set. However, computed variables are included in an output data set if you create one. The following table compares the effects of using order variables and group variables. ORDER GROUP Rows are ordered yes yes Repetitious printing of values is suppressed yes yes Rows that have the same values are collapsed no yes Type of report produced list summary Using Computed Variables This type of variable usage is reserved for computed variables, which are numeric or character variables that you define for the report. They are not in the input data set, and PROC REPORT doesn't add them to the input data set. You can't change the usage of a computed variable. In the nonwindowing environment, you add a computed variable as follows: 1. Include the computed variable in the COLUMN statement. 2. Define the variable's usage as COMPUTED in the DEFINE statement. Compute the value of the variable in a compute block that is associated with the variable. The position of a computed variable is important. PROC REPORT assigns values to the columns in a row of a report from left to right. Consequently, you can't base the calculation of a computed variable on any variable that appears to its right in the report. Example Suppose you want to determine the Patient's Glucose Range - GLUCRANGE. Calculate values of GLUCRANGE as the difference between the sum of Postprandial Glucose - POSTGLUC and the sum of Fasting Glucose - FASTGLUC (POSTGLUC contains larger values). In the following program, you specify GLUCRANGE in the COLUMN statement to the right of the variables that are used in its calculation. define GLUCRANGE as a computed variable in a DEFINE statement. begin a compute block by specifying GLUCRANGE in a COMPUTE statement. use DATA step statements in the compute block to calculate GLUCRANGE' value. Notice that when you refer to an analysis variable, you use a compound name that identifies both the original variable and the statistic that PROC REPORT now calculates from it. The compound name has the form variable-name.statistic. close the compute block with an ENDCOMP statement. proc report data=Sasuser.diabetes nowd; column sex weight fastgluc postgluc GlucRange; define fastgluc / 'Fasting/Glucose'; define postgluc / 'Postprandial/Glucose' width=12; define GlucRange / computed 'Glucose/Range'; compute GlucRange; GlucRange = postgluc.sum-fastgluc.sum; endcomp; run; You can use the following statistics in PROC REPORT: Statistic Definition CSS Corrected sum of squares USS Uncorrected sum of squares CV Coefficient of variation MAX Maximum value MEAN Average MIN Minimum value N Number of observations with nonmissing values NMISS Number of observations with missing values RANGE Range STD Standard deviation STDERR Standard error of the mean SUM Sum SUMWGT Sum of the Weight variable values. PCTN Percentage of a cell or row frequency to a total frequency PCTSUM Percentage of a cell or row sum to a total sum VAR Variance T Student's t for testing the hypothesis that the population mean is 0 PRT Probability of a greater absolute value of Student's t
