LAB EXERCISE: Statistical Analysis (calculating 95% confidence
advertisement
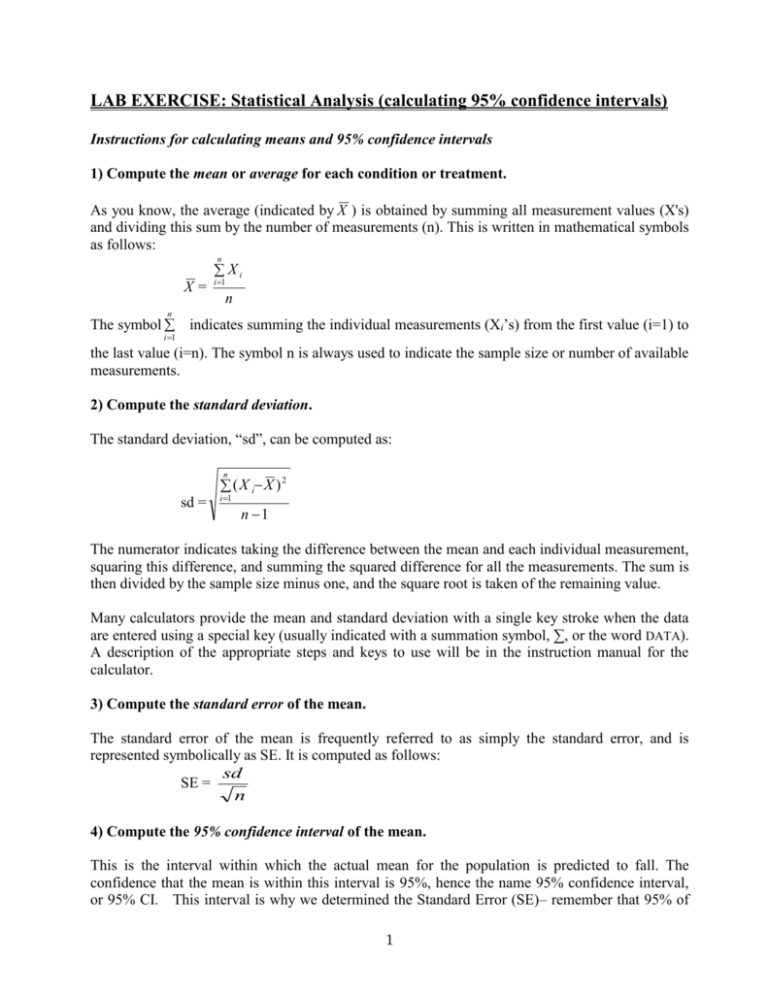
LAB EXERCISE: Statistical Analysis (calculating 95% confidence intervals) Instructions for calculating means and 95% confidence intervals 1) Compute the mean or average for each condition or treatment. As you know, the average (indicated by X ) is obtained by summing all measurement values (X's) and dividing this sum by the number of measurements (n). This is written in mathematical symbols as follows: n Xi X= i 1 n n The symbol indicates summing the individual measurements (Xi’s) from the first value (i=1) to i 1 the last value (i=n). The symbol n is always used to indicate the sample size or number of available measurements. 2) Compute the standard deviation. The standard deviation, “sd”, can be computed as: n 2 ( X i X ) sd = i 1 n 1 The numerator indicates taking the difference between the mean and each individual measurement, squaring this difference, and summing the squared difference for all the measurements. The sum is then divided by the sample size minus one, and the square root is taken of the remaining value. Many calculators provide the mean and standard deviation with a single key stroke when the data are entered using a special key (usually indicated with a summation symbol, ∑, or the word DATA). A description of the appropriate steps and keys to use will be in the instruction manual for the calculator. 3) Compute the standard error of the mean. The standard error of the mean is frequently referred to as simply the standard error, and is represented symbolically as SE. It is computed as follows: sd SE = n 4) Compute the 95% confidence interval of the mean. This is the interval within which the actual mean for the population is predicted to fall. The confidence that the mean is within this interval is 95%, hence the name 95% confidence interval, or 95% CI. This interval is why we determined the Standard Error (SE)– remember that 95% of 1 the means of similar experiments are expected to fall within 2 S.E. of our mean. Thus, the lower 95% confidence limit, represented symbolically as 95% LCL, is computed as the mean minus 2*S.E. Similarly, the upper 95% confidence limit, represented symbolically as 95% UCL, is computed as the mean plus 2*S.E. These equations can be written as: _ 95% LCL = X- 2*SE _ 95% UCL = X+ 2*SE Interpretation of 95% confidence intervals Here is a Figure showing the findings of a previously conducted experiment. Look carefully at the Figure to see how much information is conveyed. Even though you haven't read the accompanying Research Report, you should able to deduce from this figure precisely what the experiment was about and what the results were. A good figure should accomplish that goal for the reader. Later you will want to return to this figure to look carefully at the particulars of the display format. Change in mass (g) 0.5 0.45 0.4 0.35 0.3 0.25 0.2 0.1 0.2 Acid Concentration (M) Figure 1. The mean mass change in antacid tablets exposed for ten minutes to one of two different acid concentrations. N=10 antacids per concentration. The central horizontal lines represent the means. The error bars represent the 95% confidence interval. 2 Using the graph and the following rules it is possible to approximate a statistical test for answering this question by visually comparing details of the graphed samples. Rules for visual comparison of samples in order to decide if means are significantly different. 1. There is a statistically significant difference when both means fall outside of the 95% confidence intervals of the samples being compared. 2. There is not a statistically significant difference when either mean falls within the 95% confidence interval of the sample to which it is being compared. Here is a hypothetical set of frequency distributions for growth of seedlings. Apply the rules for comparing means, and determine which data sets are statistically significantly different in the graph below: Change in mas (g) 35 30 25 20 A B C D E Group Figure 2. Change in mass of five groups of seedlings given identical soils, but with the addition of extra amounts of the specified substance (5 grams of each substance was added weekly). Group A was the control group (soil only), Group B had phosphorus added, Group C had Nitrate added, Group D had Ammonium added, and group E had aluminum hydroxide added. For each Group, the central horizontal line represents the mean and the error bars are 95% confidence intervals. Which groups grew significantly faster than the control? Significantly slower? What about relationships between the experimental groups? 3 Exercise Table 1 presents the raw data for an experiment on grip strength. Table 1. Individual measurements of maximum grip strength (in Newtons) in the dominant and non-dominant hands of nine students. Student ID # 1 2 3 4 5 6 7 8 9 Dominant 28.0 28.5 29.8 31.0 31.3 32.5 34.1 34.6 34.6 21.0 26.2 29.6 27.0 22.5 27.1 29.5 29.7 31.0 Non-dominant Your assignment is to present a reduced data table which should include the mean, standard deviation, standard error, and the upper and lower confidence limits. In addition you must graph your results. In the captions be sure to include a brief statement about the data presented, the sample size, and include definitions for any abbreviations that occur in the table. Don’t forget to include the units of measurement. 4


![The Average rate of change of a function over an interval [a,b]](http://s3.studylib.net/store/data/005847252_1-7192c992341161b16cb22365719c0b30-300x300.png)

