How to use Spearman`s Rank Correlation Coefficient to relate
advertisement

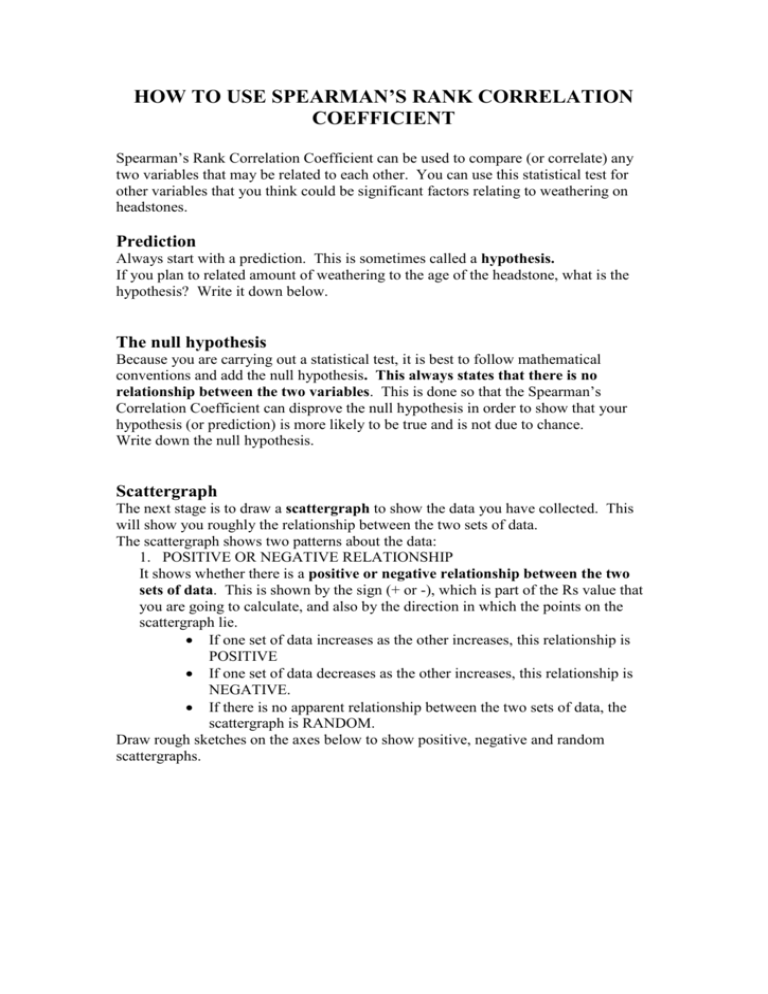
HOW TO USE SPEARMAN’S RANK CORRELATION COEFFICIENT Spearman’s Rank Correlation Coefficient can be used to compare (or correlate) any two variables that may be related to each other. You can use this statistical test for other variables that you think could be significant factors relating to weathering on headstones. Prediction Always start with a prediction. This is sometimes called a hypothesis. If you plan to related amount of weathering to the age of the headstone, what is the hypothesis? Write it down below. The null hypothesis Because you are carrying out a statistical test, it is best to follow mathematical conventions and add the null hypothesis. This always states that there is no relationship between the two variables. This is done so that the Spearman’s Correlation Coefficient can disprove the null hypothesis in order to show that your hypothesis (or prediction) is more likely to be true and is not due to chance. Write down the null hypothesis. Scattergraph The next stage is to draw a scattergraph to show the data you have collected. This will show you roughly the relationship between the two sets of data. The scattergraph shows two patterns about the data: 1. POSITIVE OR NEGATIVE RELATIONSHIP It shows whether there is a positive or negative relationship between the two sets of data. This is shown by the sign (+ or -), which is part of the Rs value that you are going to calculate, and also by the direction in which the points on the scattergraph lie. If one set of data increases as the other increases, this relationship is POSITIVE If one set of data decreases as the other increases, this relationship is NEGATIVE. If there is no apparent relationship between the two sets of data, the scattergraph is RANDOM. Draw rough sketches on the axes below to show positive, negative and random scattergraphs. 2. STRENGTH OF THE RELATIONSHIP It shows how closely related the two sets of data are. This is given by how close the points on the scattergraph are to the line of best fit and also by the Rs value that you are going to calculate. Draw the line of best fit on the scattergraphs below and say which one shows the closest relationship between the two sets of data. HOW TO USE SPEARMAN’S RANK IN YOUR COURSEWORK In this example you are going to be using Spearman’s Rank Correlation Coefficient to find out whether the amount of weathering on a headstone is related to the length of time during which it has been weathered. Rahn’s Index is a method of assessing how much weathering has taken place on a rock that has been carved with lettering, so it is ideal for using on headstones., even though it is subjective, rather than objective. The age of the headstone is found by looking at the dates carved to record the deaths of those buried beneath. There are some difficulties with the accuracy of these dates for the age of the headstone itself, which you can work out as you plan your coursework. In general, though, the age of the headstone is an objective, not a subjective, measure. AN EXAMPLE FOR YOU TO WORK OUT Here is a worked example for some data collected by an A-level student for her coursework. Hypothesis: There is a relationship between Rahn’s index and the age of the gravestone. The older the gravestone the higher the number of the Rahn’s index, i.e. the more weathered it is. Null hypothesis: There is no relationship between age of gravestone and Rahn’s index. Scattergraph Draw this on graph paper, remembering to add axis labels, title and your conclusion about whether the relationship is positive or negative and how closely the data follows the line of best fit. Table of original data with calculations for Spearman’s Rank Each pair of figures on the table below is called a set of data. For Spearman’s Rank to work well statistically, there should be from 10-30 sets of data. DO NOT START TO COMPLETE THE TABLE WITHOUT READING THE INSTRUCTIONS BELOW RANKING When you start ranking the data use a pencil. It is very easy to make errors. When you rank data, put it in order with the largest number being ranked first ie. Number 1 (technically this is not essential but makes the exercise easier to understand). If there are several numbers which are the same, then you need to share their ranks between them and give them all the average rank. For instance, if the ranks were 2,3,4,5 then the average or shared rank for all of them would be 3.5. You can back check that your ranking is correct by seeing if the last rank is the same as the total number of sets of data (or at least roughly, if the last set of data has a shared rank). You could also back check by adding up the differences between ranks and seeing if they come to zero. Age in years 177 171 155 142 142 141 133 126 125 123 123 123 119 117 97 93 90 86 82 60 55 29 26 20 12 Rank of age Rahn’s Index Rank of Rahn’s Index Difference between the ranks (d) 4 1 3 1 3 1 1 0 4 1 2 1 1 2 0 0 1 1 0 4 1 0 0 0 0 TOTAL OF d2 d2 The formula for the calculation is as follows: Rs = 1 - 6 x d2 n(n2 – 1) where: Rs is the Spearman coefficient d is the sum of the difference between the ranks n is the number of sets of data Complete the calculation using these spaces: Rs = 1 - 6 x_________ n(n2 – 1) Rs = 1 - ___________ 25(252 – 1) Rs = 1 – ____________ 25( 625 – 1) Rs = 1 - __________ 15,600 Rs = 1 – Rs = THE ANSWER SHOULD HAVE A SIGN AND A FIGURE BELOW ONE. IF THE FIGURE IS GREATER THAN ONE THEN YOU HAVE MADE AN ERROR. GO BACK AND CHECK YOUR WORKING. CONCLUSION Firstly, look at the sign. Is it positive or negative? Does it match what you expected from the scattergraph? Secondly, look at the Rs value. To find out whether there is a correlation between your two variables you need to compare the Rs value with the critical value in the table below. The critical value varies according to how many sets of data there are, so draw a line under the sets of data that you have used (25 in this example). There are two columns of critical values. If your Rs value is above the critical value in the 5% column (sometimes shown as 0.05) there is a 95% likelihood that there is a significant relationship between your variables (age and weathering in this example) which is not due to chance. If your Rs value is above the critical value in the 1% column (sometimes shown as 0.01) there is a 99% likelihood that there is a significant relationship between your variables (age and weathering in this example) which is not due to chance. Write a short conclusion to explain two ideas: The nature of the relationship between the variables, ie. is it positive or negative or is there no relationship, as shown by the Rs sign and the direction of the scattergraph line? The strength of the relationship between the variables as shown by the best fit line on the scattergraph and the Rs value you have compared with the critical value for the appropriate number of sets of data. FINALLY: Can you accept your hypothesis and reject your null hypothesis with an Rs value that is more than the critical value at 5% (95%) or 1% (99%)? Or do you have to accept the null hypothesis and reject your hypothesis because your Rs value is below the critical value at 95%? GEOLOGICAL CONCLUSIONS This student’s Rs value leads us to reject the hypothesis and accept the null hypothesis, although the sign is positive which suggests that there is a relationship between amount of weathering and age of headstone, although it may not be a very strong relationship. Why might the relationship not be as clear as we might expect? Are there any other factors that may not have been taken into account? You will have to consider a variety of variables that might be important in your gravestone study, so make a list below.


