Power Handout 2
advertisement
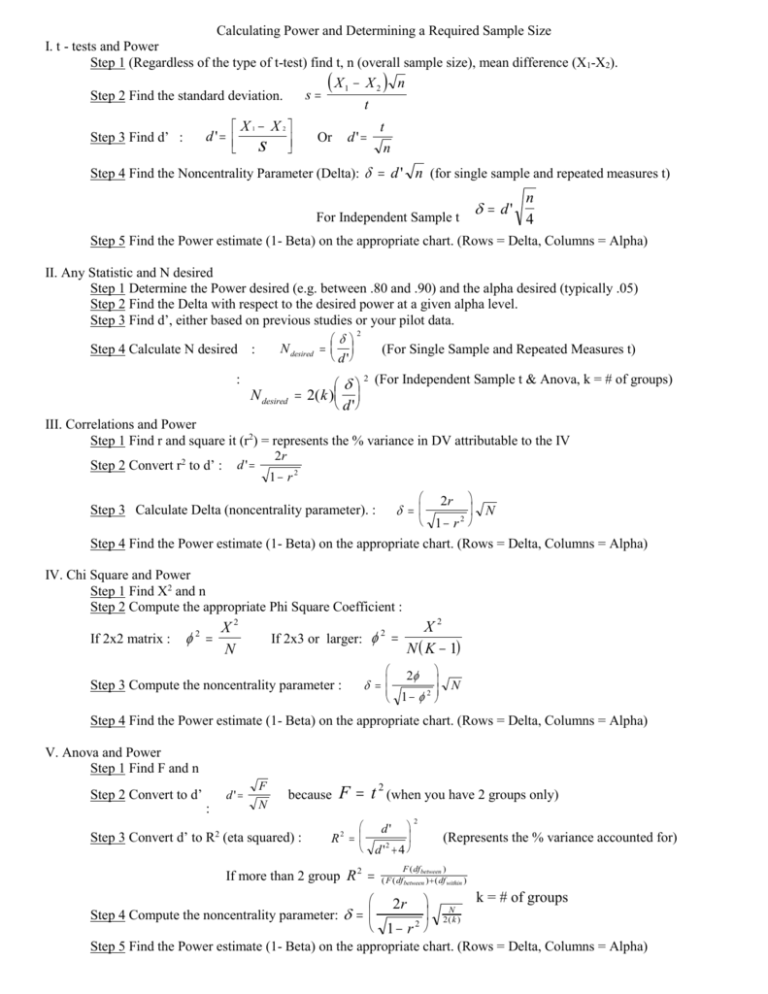
Calculating Power and Determining a Required Sample Size I. t - tests and Power Step 1 (Regardless of the type of t-test) find t, n (overall sample size), mean difference (X1-X2). s Step 2 Find the standard deviation. X1 X 2 d' s Step 3 Find d’ : X 1 X2 n t d' Or t n Step 4 Find the Noncentrality Parameter (Delta): d ' n (for single sample and repeated measures t) n d' For Independent Sample t 4 Step 5 Find the Power estimate (1- Beta) on the appropriate chart. (Rows = Delta, Columns = Alpha) II. Any Statistic and N desired Step 1 Determine the Power desired (e.g. between .80 and .90) and the alpha desired (typically .05) Step 2 Find the Delta with respect to the desired power at a given alpha level. Step 3 Find d’, either based on previous studies or your pilot data. 2 N desired Step 4 Calculate N desired : (For Single Sample and Repeated Measures t) d ' : 2 (For Independent Sample t & Anova, k = # of groups) N desired 2( k ) d ' III. Correlations and Power Step 1 Find r and square it (r2) = represents the % variance in DV attributable to the IV Step 2 Convert r2 to d’ : 2r d' 1 r2 N 1 r Step 3 Calculate Delta (noncentrality parameter). : 2r 2 Step 4 Find the Power estimate (1- Beta) on the appropriate chart. (Rows = Delta, Columns = Alpha) IV. Chi Square and Power Step 1 Find X2 and n Step 2 Compute the appropriate Phi Square Coefficient : X2 If 2x3 or larger: N K 1 X2 If 2x2 matrix : N 2 2 Step 3 Compute the noncentrality parameter : 2 N 2 1 Step 4 Find the Power estimate (1- Beta) on the appropriate chart. (Rows = Delta, Columns = Alpha) V. Anova and Power Step 1 Find F and n Step 2 Convert to d’ d' : F N because Step 3 Convert d’ to R2 (eta squared) : F t 2 (when you have 2 groups only) d' R2 d '2 4 If more than 2 group R 2 2 (Represents the % variance accounted for) F ( df between ) ( F ( df between ) ( df within ) 2r Step 4 Compute the noncentrality parameter: 1 r2 k = # of groups N 2( k ) Step 5 Find the Power estimate (1- Beta) on the appropriate chart. (Rows = Delta, Columns = Alpha)


![Kwadijk-Deltatechnology presentation [Compatibiliteitsmodus]](http://s2.studylib.net/store/data/005765666_1-8750ea686d0c834b2bb5a5055d5c4a69-300x300.png)

