testing for homoscedasticity in e -views
advertisement
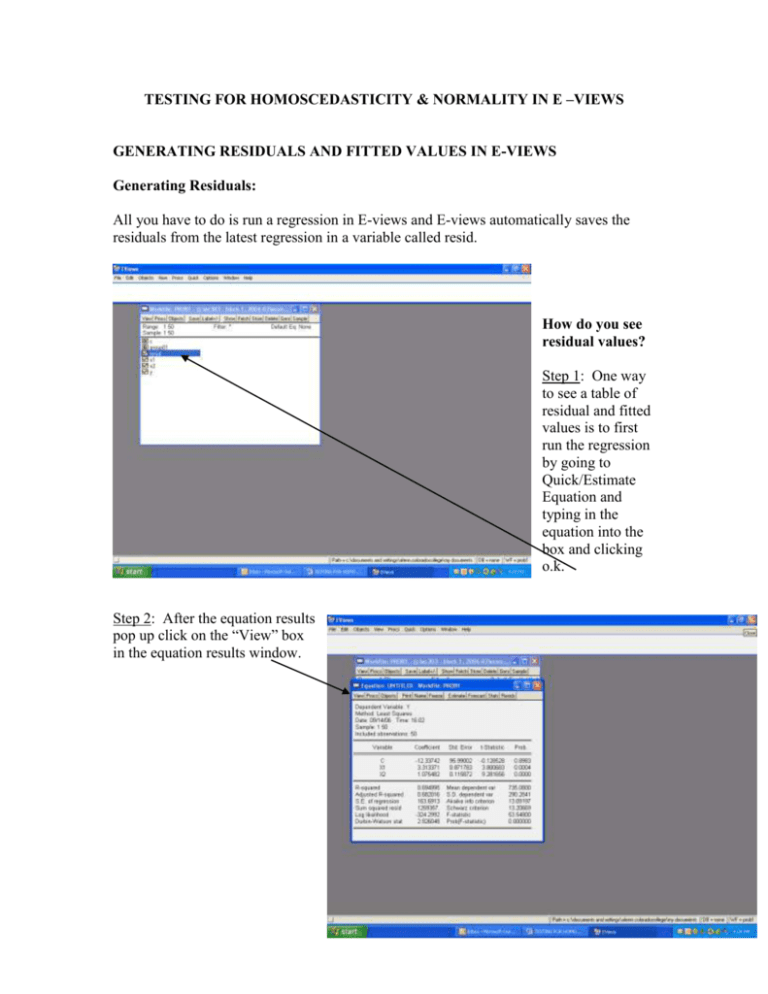
TESTING FOR HOMOSCEDASTICITY & NORMALITY IN E –VIEWS GENERATING RESIDUALS AND FITTED VALUES IN E-VIEWS Generating Residuals: All you have to do is run a regression in E-views and E-views automatically saves the residuals from the latest regression in a variable called resid. How do you see residual values? Step 1: One way to see a table of residual and fitted values is to first run the regression by going to Quick/Estimate Equation and typing in the equation into the box and clicking o.k. Step 2: After the equation results pop up click on the “View” box in the equation results window. 2 Step 3: Scroll down to “Actual, Fitted, Residual” and select actual fitted residual table. Step 4: The actual, fitted residual table will look like this: Next if you like you can copy and paste the residua l and fitted column s of data into Excel 3 and plot Residual Vs. Predicted values. Or… you can do the following to do the plot in E-views. PLOTTING RESID Vs. FITTED VALUES IN E-Views Step1: Generate fitted values in E-views. Start with the estimation box and click on the forecast button. Next e-views will generate a new variable to store the fitted values of the dependent variable. It usually takes the name of the dependent variable and adds and F to it. SO OUR FIITED VARIABLE WILL BE yf Click on the OK button and yf will be created. 4 You will see a graph like the one below. This is NOT WHAT YOU WANT. Next go up to the “Quick” menu at the main E-views toolbar. Scroll down to “Graph” and select “Scatter” 5 Then type in Resid (type in a space) and yf and hit OK. After you hit OK you get the desired graph of Resid Vs. Fitted values that you want!! 6 GENERATING THE WHITE STAT FOR THE WHITE TEST Step 1: From the regression equations results box click on “View” Step 2: Scroll down to “Residual Tests” and click on “White Heteroskedasticity no cross terms” 7 The output that follows gives you White’s Test statistic. If this number is larger than the critical Chi-square value from the table you have a problem with Heteroskedasticity. 8 To Adjust the Standard Errors to account for Heteroscedasticity - from the equation output window click on estimate and then click on OPTIONS. Then check the box for Heteroscedasticty consistent coefficient covariance. 9 Then click OK a couple of times and you should get regression results with standard errors that are adjusted for Heteroscedasticity 10 GENERATING THE JARQUE-BERA STAT Step 1: From the regression equations results box click on “View” Step 2: Scroll down to “Residual Tests” and click on “Histogram-Normality” 11 Step 3: Read the Jarque Bera stat to the right of the Histogram, if the number is bigger than 5.99 (Chi-square with 2 df at the 5 % level) your error terms are not normally distributed and you have a problem. If you have a problem with normality consider using a transformation of the dependent variable such as Log(Y), 1/Y, Suare Root(Y) etc. If that does not work – see your thesis advisor.
