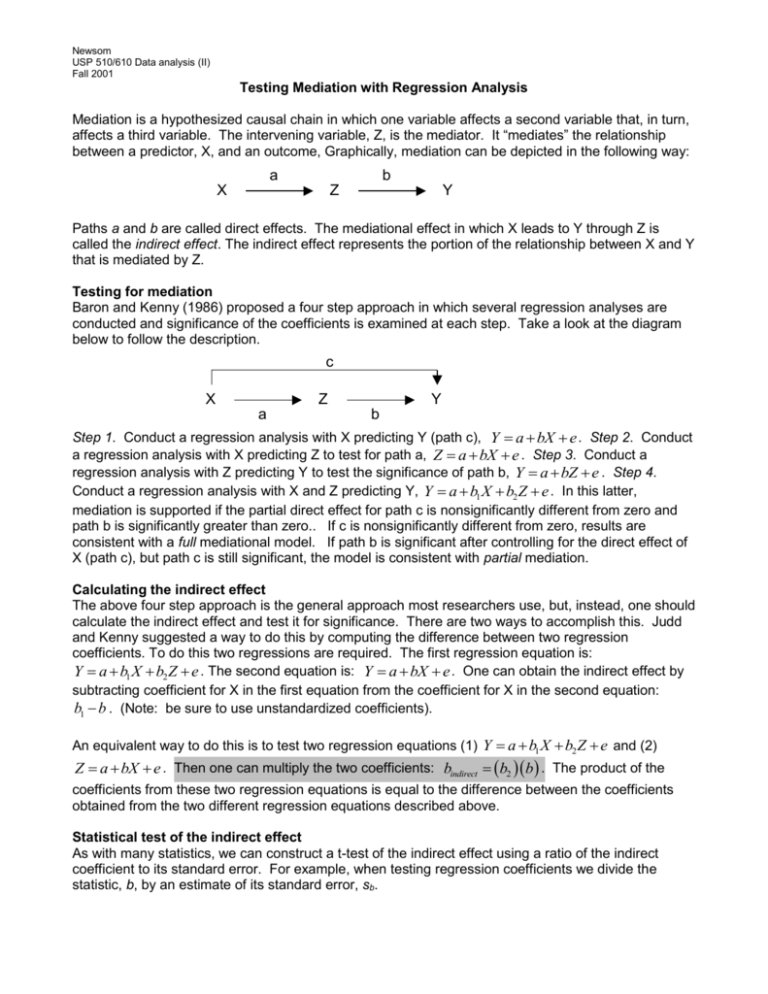
Testing for mediation
advertisement

Newsom USP 510/610 Data analysis (II) Fall 2001 Testing Mediation with Regression Analysis Mediation is a hypothesized causal chain in which one variable affects a second variable that, in turn, affects a third variable. The intervening variable, Z, is the mediator. It “mediates” the relationship between a predictor, X, and an outcome, Graphically, mediation can be depicted in the following way: a b X Z Y Paths a and b are called direct effects. The mediational effect in which X leads to Y through Z is called the indirect effect. The indirect effect represents the portion of the relationship between X and Y that is mediated by Z. Testing for mediation Baron and Kenny (1986) proposed a four step approach in which several regression analyses are conducted and significance of the coefficients is examined at each step. Take a look at the diagram below to follow the description. c X Z a Y b Step 1. Conduct a regression analysis with X predicting Y (path c), Y a bX e . Step 2. Conduct a regression analysis with X predicting Z to test for path a, Z a bX e . Step 3. Conduct a regression analysis with Z predicting Y to test the significance of path b, Y a bZ e . Step 4. Conduct a regression analysis with X and Z predicting Y, Y a b1 X b2 Z e . In this latter, mediation is supported if the partial direct effect for path c is nonsignificantly different from zero and path b is significantly greater than zero.. If c is nonsignificantly different from zero, results are consistent with a full mediational model. If path b is significant after controlling for the direct effect of X (path c), but path c is still significant, the model is consistent with partial mediation. Calculating the indirect effect The above four step approach is the general approach most researchers use, but, instead, one should calculate the indirect effect and test it for significance. There are two ways to accomplish this. Judd and Kenny suggested a way to do this by computing the difference between two regression coefficients. To do this two regressions are required. The first regression equation is: Y a b1 X b2 Z e . The second equation is: Y a bX e . One can obtain the indirect effect by subtracting coefficient for X in the first equation from the coefficient for X in the second equation: b1 b . (Note: be sure to use unstandardized coefficients). An equivalent way to do this is to test two regression equations (1) Y a b1 X b2 Z e and (2) Z a bX e . Then one can multiply the two coefficients: bindirect b2 b . The product of the coefficients from these two regression equations is equal to the difference between the coefficients obtained from the two different regression equations described above. Statistical test of the indirect effect As with many statistics, we can construct a t-test of the indirect effect using a ratio of the indirect coefficient to its standard error. For example, when testing regression coefficients we divide the statistic, b, by an estimate of its standard error, sb. Newsom USP 510/610 Data analysis (II) Fall 2001 tindirect bindirect sbindirect Remember that the sampling distribution is a frequency distribution for a statistic if it was calculated in an infinite number of samples of the same size (drawn from the same population). The standard error for any statistic is the estimate of the standard deviation for that sampling distribution. Three Approaches to Standard Error Computation Sobel (1982) proposed an approximate test of the standard error using the following formula: sb b2 sa2 a 2 sb2 Baron & Kenny (1986) present a different formula, which they refer to as the population value. In other words, all the parameter estimates are assumed to be population values rather than sample estimates sb b2 sa2 a 2 sb2 sa2 sb2 Goodman (1960) gives the following formula, which seems to be a more exact estimate. sb b2 sa2 a 2 sb2 sa2 sb2 For all of the formulas above, refer to the diagram on Page 1 for the notation. b2 represents the unstandardized coefficient for the path in the diagram designated as b, a2 represents the square of the unstandardized coefficient for the path designated a, sa2 represents the square of the standard error for the coefficient for path a, and sb2 is the square of the standard error for path b. Notice that these formulas are all rather similar—the only difference is the last term, sa2 sb2 , the product of the two standard errors. This last term will have a smaller impact when standard errors are small and when sample sizes are large. Online resources Online calculation of sobel test: http://quantrm2.psy.ohio-state.edu/kris/sobel/sobel.htm Dave McKinnon’s website on mediation analysis: http://www.public.asu.edu/~davidpm/ripl/mediate.htm David Kenny also has a webpage on mediation: http://nw3.nai.net/~dakenny/mediate.htm Further reading on mediation Judd, C.M. & Kenny, D.A. (1981). Process Analysis: Estimating mediation in treatment evaluations. Evaluation Review, 5(5), 602619. Goodman, L. A. (1960). On the exact variance of products. Journal of the American Statistical Association, 55, 708-713. Hoyle, R. H., & Kenny, D. A. (1999). Statistical power and tests of mediation. In R. H. Hoyle (Ed.), Statistical strategies for small sample research. Newbury Park: Sage. MacKinnon, D.P. & Dwyer, J.H. (1993). Estimating mediated effects in prevention studies. Evaluation Review, 17(2), 144-158. Sobel, M. E. (1982). Asymptotic confidence intervals for indirect effects in structural equation models. In S. Leinhardt (Ed.), Sociological Methodology 1982 (pp. 290-312). Washington DC: American Sociological Association.


