HW Set # 4
advertisement
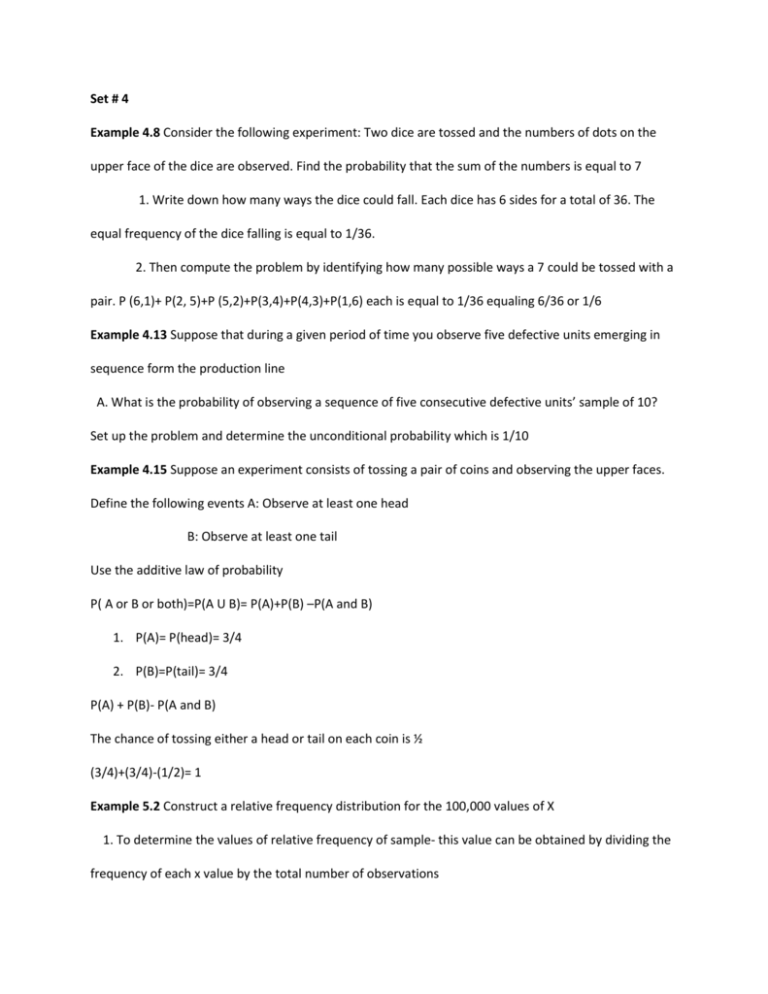
Set # 4 Example 4.8 Consider the following experiment: Two dice are tossed and the numbers of dots on the upper face of the dice are observed. Find the probability that the sum of the numbers is equal to 7 1. Write down how many ways the dice could fall. Each dice has 6 sides for a total of 36. The equal frequency of the dice falling is equal to 1/36. 2. Then compute the problem by identifying how many possible ways a 7 could be tossed with a pair. P (6,1)+ P(2, 5)+P (5,2)+P(3,4)+P(4,3)+P(1,6) each is equal to 1/36 equaling 6/36 or 1/6 Example 4.13 Suppose that during a given period of time you observe five defective units emerging in sequence form the production line A. What is the probability of observing a sequence of five consecutive defective units’ sample of 10? Set up the problem and determine the unconditional probability which is 1/10 Example 4.15 Suppose an experiment consists of tossing a pair of coins and observing the upper faces. Define the following events A: Observe at least one head B: Observe at least one tail Use the additive law of probability P( A or B or both)=P(A U B)= P(A)+P(B) –P(A and B) 1. P(A)= P(head)= 3/4 2. P(B)=P(tail)= 3/4 P(A) + P(B)- P(A and B) The chance of tossing either a head or tail on each coin is ½ (3/4)+(3/4)-(1/2)= 1 Example 5.2 Construct a relative frequency distribution for the 100,000 values of X 1. To determine the values of relative frequency of sample- this value can be obtained by dividing the frequency of each x value by the total number of observations X 0 1 2 3 4 5 Frequency 32891 40929 20473 5104 599 4 Relative frequency .32891 .40929 .20473 .05104 .00599 .00004 2. Show that the properties of a probability distribution are satisfied To determine sum up all values of X and determine whether distribution is between 0 and 1. Example 5.3 Computing the Mean and standard deviation Find the mean for example 5.2 Using the formula- find the expected value of X- You find the expected value of X by referring to table 5.1. X is the observations of X in the sample size of N=5 μ = Sum of each x times P( X = x) = Σ x p(x) a. 1. Substitute where p(x) is given in table – these values can be obtained by dividing the frequency by the total number of observations ie x=0 frequency 32,891/100,000- total number of observations- relative frequency 2. Sum up all the values of x corresponding to the sample b. Interpret the value of μ - the value of the mean can by obtained by adding the values of x and dividing the sum by the sample size. For this example the μ = 1.0. Interpretation of μ indicates that over a period of time that number of consumers who favor Brand A will be equal to 1.o. The mean of a random variable provides the long run average of the variable or expected average outcome over many observations c. Find the standard deviation of X 1. The variance is equal to the [sum of x^2p(x)]- μ^2 . First you substitute the values of the unknown and compute to get the standard deviation. Compute the mean using the formula from part A , square the value of X corresponding to the sample and solve. Ie μ =sumxp(x), μ = 0(p)0+ 1(p)1+2(p)2……………. Next square the values of X ie 0(p)0+ 1(p)+ 4(p)2+ 9(p)3…………- (1)^2 Now plug in values of p(x) ie. 0(.32768)+ 1(.40960)+4(.20480)…….- 1 This gives the variance, finally complete the problem by square rooting the value gives the standard deviation. Example 5.4 Locate the interval using the empirical rule application μ ±2(standard deviation) For the sample compute both the mean and standard deviation, then substitute the unknown values for the known values. Compute and complete the problem. The interval for the problem show a range of -.788 to 2.788 and includes the values=0, x=1,x=2. Now sum all the values of the relative frequency or probability to determine the interval the population value falls within. Ie P(0)+p(1)+p(2)= .32768+.40960+.20480= .94208. The value shows agrees with the empirical rule that 95% will lie within the 2(standard deviation) of the mean Example 5.8. Summing binomial probabilities- Refer to 5.7 find the probability that three or more persons in the sample prefer Brand A. This problem is simple asking to find the probability of 3 or more observations, when applying probability rule #1 the probability of 3 mutually exclusive events is equal to the sum of their respective probabilities.
