EDUC5504 Ch10 Study Guide
advertisement
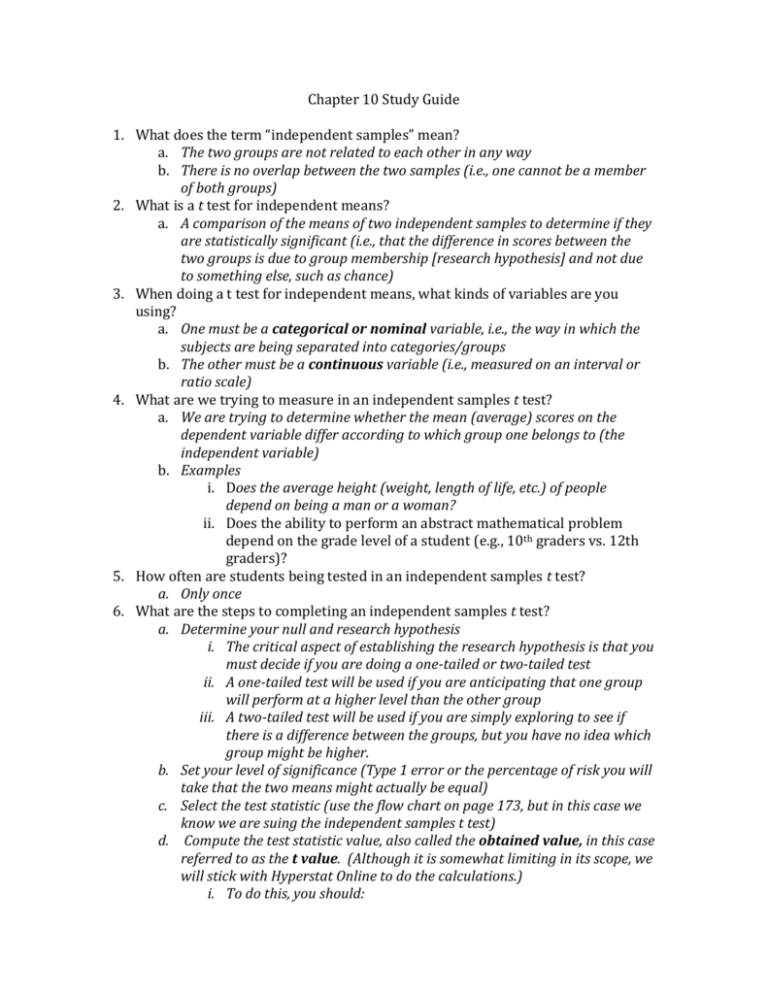
Chapter 10 Study Guide 1. What does the term “independent samples” mean? a. The two groups are not related to each other in any way b. There is no overlap between the two samples (i.e., one cannot be a member of both groups) 2. What is a t test for independent means? a. A comparison of the means of two independent samples to determine if they are statistically significant (i.e., that the difference in scores between the two groups is due to group membership [research hypothesis] and not due to something else, such as chance) 3. When doing a t test for independent means, what kinds of variables are you using? a. One must be a categorical or nominal variable, i.e., the way in which the subjects are being separated into categories/groups b. The other must be a continuous variable (i.e., measured on an interval or ratio scale) 4. What are we trying to measure in an independent samples t test? a. We are trying to determine whether the mean (average) scores on the dependent variable differ according to which group one belongs to (the independent variable) b. Examples i. Does the average height (weight, length of life, etc.) of people depend on being a man or a woman? ii. Does the ability to perform an abstract mathematical problem depend on the grade level of a student (e.g., 10th graders vs. 12th graders)? 5. How often are students being tested in an independent samples t test? a. Only once 6. What are the steps to completing an independent samples t test? a. Determine your null and research hypothesis i. The critical aspect of establishing the research hypothesis is that you must decide if you are doing a one-tailed or two-tailed test ii. A one-tailed test will be used if you are anticipating that one group will perform at a higher level than the other group iii. A two-tailed test will be used if you are simply exploring to see if there is a difference between the groups, but you have no idea which group might be higher. b. Set your level of significance (Type 1 error or the percentage of risk you will take that the two means might actually be equal) c. Select the test statistic (use the flow chart on page 173, but in this case we know we are suing the independent samples t test) d. Compute the test statistic value, also called the obtained value, in this case referred to as the t value. (Although it is somewhat limiting in its scope, we will stick with Hyperstat Online to do the calculations.) i. To do this, you should: 1. Set up your groups and their accompanying scores. The example below shows how I would set up the data for question #1 at the end of the chapter. In this data, I have used 1 to represent the boys and 2 to represent girls. The second variable accounts for the number of times that the student put his/her hand up. Gender 1 2 2 2 1 1 2 2 1 1 2 1 2 1 2 1 2 1 2 1 2 2 2 2 1 1 1 1 2 2 Handup 9 3 5 1 8 4 2 6 9 3 4 8 3 10 6 8 7 9 9 8 7 3 7 6 10 7 6 12 8 8 2. After you have entered the data into the Hyperstat Lab Analysis Tool, select the variables. This time we will be selecting the grouping variable instead of the predictor variable. This is because we have two independent groups we are analyzing. The “handup” variable is the dependent variable because we are testing to see if it varies by group. 3. You will now see that the Analysis Lab offers “independent groups t test and confidence interval for ‘handup’” under the section entitled t-test/conf interval. Click on this. 4. You now have the data needed to evaluate the significance of the difference between your two group means. The following information is currently pertinent: a. Mean 1 = the mean of the group of boys b. Mean 2 = the mean of the group of girls c. Mean 1 – Mean 2 = the difference between the two means d. t the t statistic (or t value) that is obtained once it is calculated using the formula on page 176 e. df = the degrees of freedom that are used on Table B.2 (see pages 333-334) f. p = the probability level (p-value) at which you are likely to be making a Type 1 error (that is rejecting a null hypothesis when it is really true) g. 95% confidence interval—don’t worry about this term for now e. The rest of the steps described in your textbook (steps 5-8 on pages 176 – 178) have already been done for you by the computer. Here are some important things for you to remember, though: i. The degrees of freedom are determined by adding together the total number of subjects in each group and subtracting 2 (1 for each group) ii. Even if you don’t have a computer program giving you the exact pvalue, you can use the t-test table on pages 333-334 to determine if you are above or below your established significance level. iii. The t-test table on pages 333-334 is navigated by looking for the degrees of freedom; sometimes you will have to choose whether to go higher or lower if your exact number of degrees of freedom are not present. iv. You will also have to determine if you are doing a one-tailed or twotailed test to decide which side of the chart to look at. v. Compare your established t value to the t values on the correct side of the chart to determine whether you have met your established significance level. In the example given, you will find that the t value of 3.0058 is not only significant at the p< 0.05 level but also significant at the p<0.01 level. This explains why the actual calculated value is p=0.0055 on the Hyperstat Analysis Lab. Data for Question 3 Inhome = 1 Out of home = 2 Group 1 1 1 1 1 1 1 1 1 1 1 1 1 1 1 1 1 1 1 1 2 2 2 2 2 2 2 2 2 2 2 2 2 2 2 2 2 2 2 2 Anxiety 3 4 1 1 1 3 3 6 5 1 4 5 4 4 3 6 7 7 7 8 7 6 7 8 7 6 5 6 4 2 5 4 3 6 7 5 4 3 8 7
