Nearest neighbor calculation:
advertisement
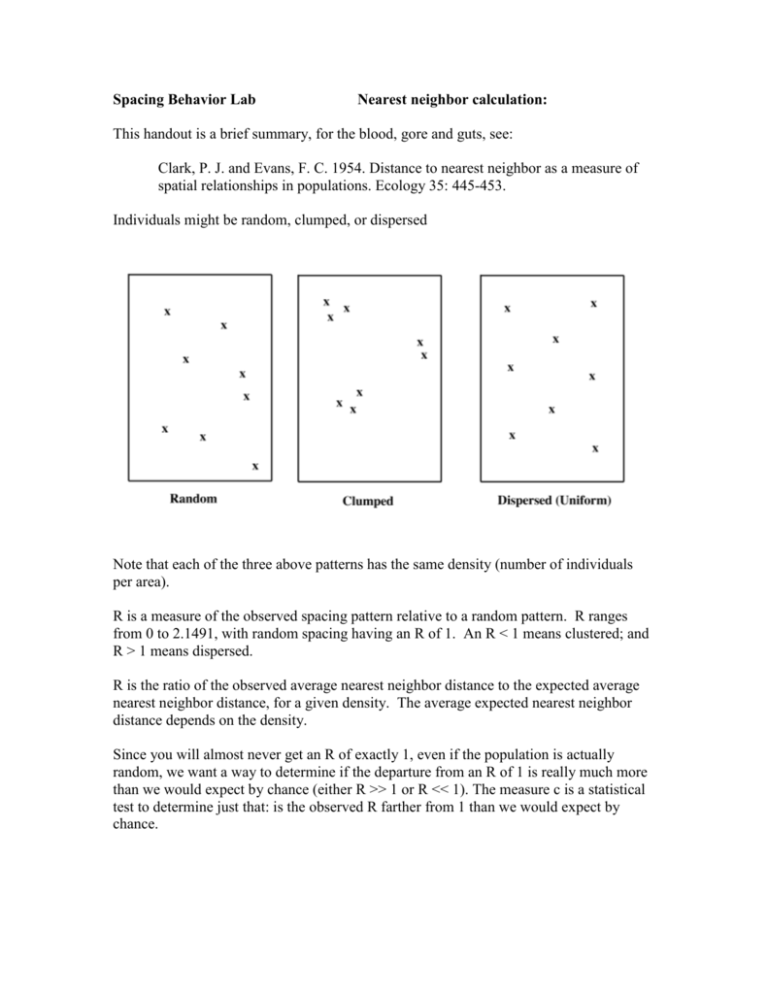
Spacing Behavior Lab Nearest neighbor calculation: This handout is a brief summary, for the blood, gore and guts, see: Clark, P. J. and Evans, F. C. 1954. Distance to nearest neighbor as a measure of spatial relationships in populations. Ecology 35: 445-453. Individuals might be random, clumped, or dispersed Note that each of the three above patterns has the same density (number of individuals per area). R is a measure of the observed spacing pattern relative to a random pattern. R ranges from 0 to 2.1491, with random spacing having an R of 1. An R < 1 means clustered; and R > 1 means dispersed. R is the ratio of the observed average nearest neighbor distance to the expected average nearest neighbor distance, for a given density. The average expected nearest neighbor distance depends on the density. Since you will almost never get an R of exactly 1, even if the population is actually random, we want a way to determine if the departure from an R of 1 is really much more than we would expect by chance (either R >> 1 or R << 1). The measure c is a statistical test to determine just that: is the observed R farther from 1 than we would expect by chance. Information needed. N = number of individuals who had a nearest neighbor measurement taken r = nearest neighbor distance p = the density of individuals (in the same units as neighbor distances) Calculate rA = the average nearest neighbor distance = (SUM of r)/N rE = the expected average nearest neighbor distance IF population was random = 1/(2*(sqrt(p)) R = spacing measure = rA/rE sigma rE = standard error of mean distance IF population was random = 0.26136/(sqrt(Np)) c = standard variate of normal curve = (rA – rE)/sigma rE If c is bigger than 1.96 or less than –1.96 then the chance of your observed departure from random happening by chance is less than 5%. If c is greater than 2.58 or less than –2.58 then the chance of your observed departure from random happening by chance is less than 1%.
