HOMEWORK - One Sample t
advertisement

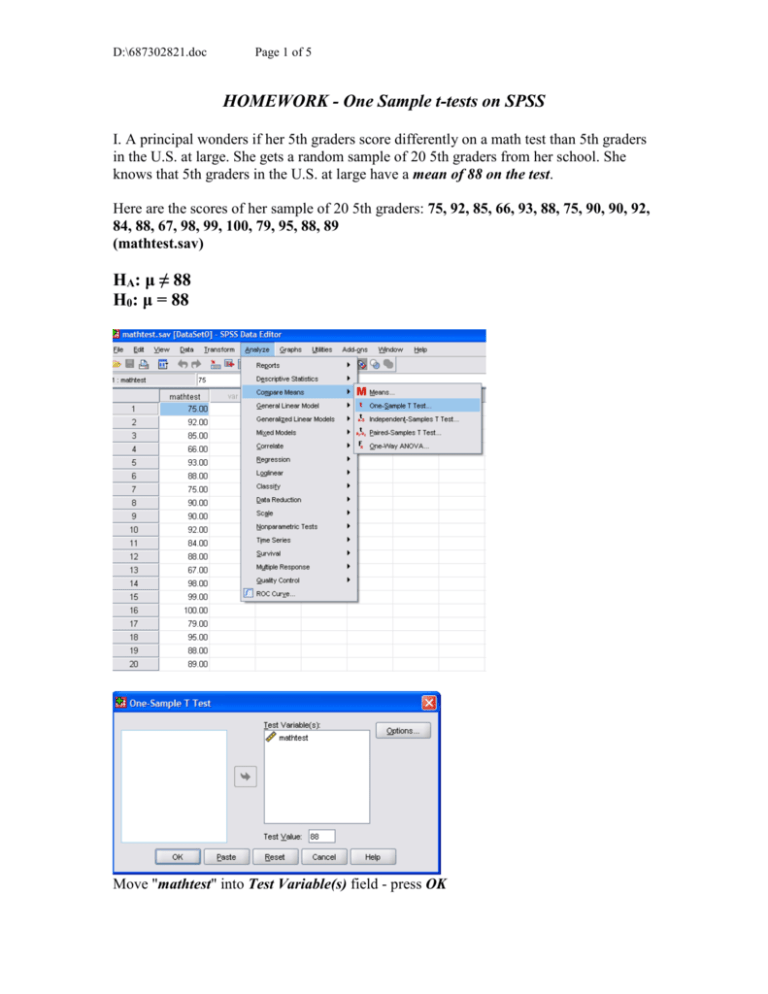
D:\687302821.doc Page 1 of 5 HOMEWORK - One Sample t-tests on SPSS I. A principal wonders if her 5th graders score differently on a math test than 5th graders in the U.S. at large. She gets a random sample of 20 5th graders from her school. She knows that 5th graders in the U.S. at large have a mean of 88 on the test. Here are the scores of her sample of 20 5th graders: 75, 92, 85, 66, 93, 88, 75, 90, 90, 92, 84, 88, 67, 98, 99, 100, 79, 95, 88, 89 (mathtest.sav) HA: μ ≠ 88 H0: μ = 88 Move "mathtest" into Test Variable(s) field - press OK D:\687302821.doc Page 2 of 5 SEM = SD/ root of N = 9.77/ root of 20 = 9.77/4.47 = 2.19 (Same as above under Std. Error Mean t = (mean of sample - mean of population)/SEM = (86.65 - 88)/2.19 = -1.35/2.19 = -.62 (Same as above under t) mean of her students: 86.65 t value from the test above: -.618 Critical t from t-table for 19 df = 2.093 Ours is .62 - which is not that rare p value (Sig.) from above = .544 So, the test is NOT SIGNIFICANT and we FAIL TO REJECT THE NULL Fifth graders from her school do NOT differ in their performance from the overall population mean of 88. We have no evidence that fifth graders from her school perform better or worse than 5th graders in the population). ***** II. A researcher wants to test estimates of distance between two poles among 10 students to see if they differ from the mean estimates of students in the past. In the past, the mean estimate was 27 feet. Here are the estimates in feet for her 10 students: Here are 10 estimates: 31, 30, 26, 38, 29, 30, 34, 38, 28, 22 Use SPSS to run a one sample t-test to determine if the students' mean estimate differs from the estimate of 27 feet in the past. D:\687302821.doc Page 3 of 5 HA: μ ≠ H0: μ = Copy the information from the printout into the following tables: One-Sample Statistics N Mean Std. Deviation One-Sample Test Test Value = t df Sig. (2-tailed) Mean Difference Std. Error Mean 95% conf. 95% conf. Lower Upper Mean estimate of the 10 students: _____ 1. Was the test significant? _________ 2. What was the t value in the test above? _________ 3. What is the critical t from a t-table? _______ 4. Is the test SIGNIFICANT? _____ 5. What was the p value (sig.) above? _____ 6. Do you REJECT the null hypothesis or FAIL TO REJECT? _______________________ 7. What do you report to the teacher - does it appear that her students estimates are different from the estimates of students in the past? ___________________ 8. If you answered "yes" to #7, tell whether her students' estimates are higher or lower than past students: ________________________________ *********** III. A researcher is interested in the number of days that successful athletes train to run a full marathon. She gets the workout logs for one year for all the athletes who completed a specific marathon in less than four hours. On the average, these athletes of the past trained for 305 days per year. She is in charge of the training for 20 athletes. After they run the marathon, she wonders whether their training differed in amount from the training of successful athletes in the past. Here are the number of days per year her 20 athletes trained: 230, 220, 214, 300, 310, 299, 200, 240, 305, 288, 297, 215, 199, 233, 255, 280, 303, 277, 280, 299 Use SPSS to run a one sample t-test to determine if the students' mean number of training days per year differs from the mean of 305 days in the past. D:\687302821.doc Page 4 of 5 HA: μ ≠ H0: μ = Copy the information from the printout into the following tables: One-Sample Statistics N Mean Std. Deviation One-Sample Test Test Value = t df Sig. (2-tailed) Mean Difference Std. Error Mean 95% conf. 95% conf. Lower Upper Mean number of days training of the 20 athletes: _____ 1. Was the test significant? _________ 2. What was the t value in the test above? _________ 3. What is the critical t from a t-table? _______ 4. Is the test SIGNIFICANT? _____ 5. What was the p value (sig.) above? _____ 6. Do you REJECT the null hypothesis or FAIL TO REJECT? _______________________ 7. What do you report to the trainer - does it appear that her runners trained a different amount than, students in the past? ___________________ 8. If you answered "yes" to #7, tell whether her runners trained more or fewer days than past athletes: ________________________________ *********** IV. A researcher knows that the mean yearly income of all graduates of a certain college is $75,000. She wonders how students at her university compares. She gets a random sample of 15 graduates of her college and determines their yearly income. Here are the yearly incomes of her sample of 15 graduates: 56000, 164,000, 250,500, 85,000, 95,000, 66,000, 123,000, 42,000, 85,595, 95,230, 55,430, 88,010, 142,000, 105,000, 110,000 Use SPSS to run a one sample t-test to determine if the mean income of graduates of her college differs from the mean of $75,000 per year for all college graduates. (DO NOT ENTER COMMAS INTO SPSS DATA.) HA: μ ≠ H0: μ = D:\687302821.doc Page 5 of 5 Copy the information from the printout into the following tables: One-Sample Statistics N Mean Std. Deviation One-Sample Test Test Value = t df Sig. (2-tailed) Mean Difference Std. Error Mean 95% conf. 95% conf. Lower Upper Mean income of the 15 graduates: _____ 1. Was the test significant? _________ 2. What was the t value in the test above? _________ 3. What is the critical t from a t-table? _______ 4. Is the test SIGNIFICANT? _____ 5. What was the p value above? _____ 6. Do you REJECT the null hypothesis or FAIL TO REJECT? _______________________ 7. What do you report to the professor - does it appear that graduates of her college have a different income than that of college graduates in the population?___________________ 8. If you answered "yes" to #7, tell whether graduates of her college tend to make MORE or LESS than college graduates in the population: _______________________________ END


