SARC Template 1011 01612590115238 English
advertisement
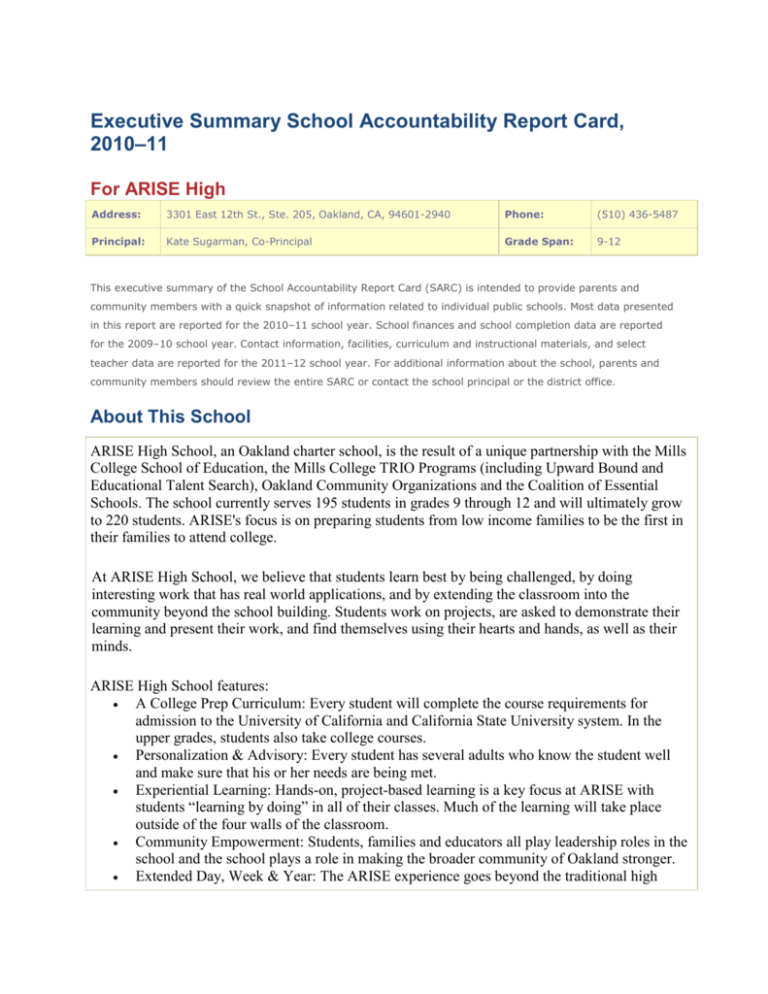
Executive Summary School Accountability Report Card, 2010–11 For ARISE High Address: 3301 East 12th St., Ste. 205, Oakland, CA, 94601-2940 Phone: (510) 436-5487 Principal: Kate Sugarman, Co-Principal Grade Span: 9-12 This executive summary of the School Accountability Report Card (SARC) is intended to provide parents and community members with a quick snapshot of information related to individual public schools. Most data presented in this report are reported for the 2010–11 school year. School finances and school completion data are reported for the 2009–10 school year. Contact information, facilities, curriculum and instructional materials, and select teacher data are reported for the 2011–12 school year. For additional information about the school, parents and community members should review the entire SARC or contact the school principal or the district office. About This School ARISE High School, an Oakland charter school, is the result of a unique partnership with the Mills College School of Education, the Mills College TRIO Programs (including Upward Bound and Educational Talent Search), Oakland Community Organizations and the Coalition of Essential Schools. The school currently serves 195 students in grades 9 through 12 and will ultimately grow to 220 students. ARISE's focus is on preparing students from low income families to be the first in their families to attend college. At ARISE High School, we believe that students learn best by being challenged, by doing interesting work that has real world applications, and by extending the classroom into the community beyond the school building. Students work on projects, are asked to demonstrate their learning and present their work, and find themselves using their hearts and hands, as well as their minds. ARISE High School features: A College Prep Curriculum: Every student will complete the course requirements for admission to the University of California and California State University system. In the upper grades, students also take college courses. Personalization & Advisory: Every student has several adults who know the student well and make sure that his or her needs are being met. Experiential Learning: Hands-on, project-based learning is a key focus at ARISE with students “learning by doing” in all of their classes. Much of the learning will take place outside of the four walls of the classroom. Community Empowerment: Students, families and educators all play leadership roles in the school and the school plays a role in making the broader community of Oakland stronger. Extended Day, Week & Year: The ARISE experience goes beyond the traditional high school schedule. Students attend school until 5:15 in the evening, as well as regularly scheduled Saturday programs. In addition, all students participate in a minimum of two summer programs. Cultural Immersion Experiences: All students participate in a program, often during the summer, in which they are exposed to a culture that is very different from the one from which they come. These valuable experiences, among other things, prepare students for the challenges of adjusting to a four-year college. Service Learning: A focus of the coursework is for students to engage in meaningful work and projects that contribute something to the community. College Advising: Through the school’s partnership with the Mills TRIO Program, all students receive extensive support in applying to, getting accepted by, and attending college. Lab for Mills Educators & the Coalition of Essential Schools: There are many additional adults who are training to become teachers and school leaders spending time at the school learning from the exciting and innovative components and practices in evidence. Faculty from Mills College as well as educators from the national CES Small Schools Project network play a role in shaping and supporting the school’s design and curriculum. Student Enrollment Group Number of students Enrollment 216 Black or African American 5.1% American Indian or Alaska Native 5.1% Asian 0.0% Filipino 0.5% Hispanic or Latino 66.2% Native Hawaiian or Pacific Islander 0.9% White 8.3% Two or More Races 1.4% Socioeconomically Disadvantaged 62.0% English Learners 52.3% Students with Disabilities 1.9% Teachers Indicator Teachers Teachers with full credential 10 Teachers without full credential 0 Teachers Teaching Outside Subject Area of Competence 0 Misassignments of Teachers of English Learners 0 Total Teacher Misassignments 0 Student Performance Subject Students Proficient and Above on STAR* Program Results English-Language Arts 16% Mathematics 8% Science 6% History-Social Science 0% *Standardized Testing and Reporting Program assessments used for accountability purposes include the California Standards Tests, the California Modified Assessment, and the California Alternate Performance Assessment. Academic Progress* Indicator Result 2011 Growth API Score (from 2011 Growth API Report) 569 Statewide Rank (from 2010 Base API Report) Met All 2011 AYP Requirements Number of AYP Criteria Met Out of the Total Number of Criteria Possible 2011–12 Program Improvement Status (PI Year) 1 Yes Met 5 of 5 Year 1 *The Academic Performance Index is required under state law. Adequate Yearly Progress is required by federal law. School Facilities Summary of Most Recent Site Inspection Arise High School’s facility recently underwent a significant expansion, which included a comprehensive building inspection and fire inspection. Repairs Needed None Corrective Actions Taken or Planned None Curriculum and Instructional Materials Pupils Who Lack Textbooks and Instructional Materials Core Curriculum Area Reading/Language Arts 0 Mathematics 0 Science 0 History-Social Science 0 Foreign Language 0 Health 0 Visual and Performing Arts 0 Science Laboratory Equipment (grades 912) 0 School Finances Level Expenditures Per Pupil (Unrestricted Sources Only) School Site District $10,425 n/a State $5,455 School Completion Indicator Graduation Rate (if applicable) Result 98% Postsecondary Preparation Measure Pupils Who Completed a Career Technical Education Program and Earned a High School Diploma Percent 0% Graduates Who Completed All Courses Required for University of California or California State University Admission 100.0% School Accountability Report Card Reported Using Data from the 2010–11 School Year Published During 2011–12 Every school in California is required by state law to publish a School Accountability Report Card (SARC), by February 1 of each year. The SARC contains information about the condition and performance of each California public school. For more information about SARC requirements, see the California Department of Education (CDE) SARC Web page at http://www.cde.ca.gov/ta/ac/sa/. For additional information about the school, parents and community members should contact the school principal or the district office. I. Data and Access Ed-Data Partnership Web Site Ed-Data is a partnership of the CDE, EdSource, and the Fiscal Crisis and Management Assistance Team (FCMAT) that provides extensive financial, demographic, and performance information about California’s public kindergarten through grade twelve school districts and schools. DataQuest DataQuest is an online data tool located on the CDE DataQuest Web page at http://dq.cde.ca.gov/dataquest/ that contains additional information about this school and comparisons of the school to the district, the county, and the state. Specifically, DataQuest is a dynamic system that provides reports for accountability (e.g., state Academic Performance Index [API], federal Adequate Yearly Progress [AYP]), test data, enrollment, high school graduates, dropouts, course enrollments, staffing, and data regarding English learners. Internet Access Internet access is available at public libraries and other locations that are publicly accessible (e.g., the California State Library). Access to the Internet at libraries and public locations is generally provided on a first-come, first- served basis. Other use restrictions may include the hours of operation, the length of time that a workstation may be used (depending on availability), the types of software programs available on a workstation, and the ability to print documents. II. About This School Contact Information (School Year 2011–12) School District School Name ARISE High District Name Oakland Unified Street 3301 East 12th St., Ste. 205 Phone Number (510) 879-8582 City, State, Zip Oakland, CA, 94601-2940 Web Site www.ousd.k12.ca.us Phone Number (510) 436-5487 Superintendent Anthony Smith Principal Kate Sugarman, Co-Principal E-mail Address tony.smith@ousd.k12.ca.us E-mail Address kate@arisehighschool.org CDS Code 01612590115238 School Description and Mission Statement (School Year 2010–11) The mission of ARISE High School is to empower students with the skills and knowledge to pursue higher education and become leaders in the world. ARISE High School will also provide an environment for training educators to become leaders in secondary school reform. Our Principles include our 7 Habits of Heart and Mind: The Habit of Collaboration: Accepting and giving assistance; working with diverse groups of people The Habit of Perseverance: Seeing things through and staying in there even in the face of adversity The Habit of Exploration & Innovation: Seeking and being open to new experiences and ideas; taking risks and meeting challenges The Habit of Leadership & Integrity: Taking initiative in the service of the common good; doing the right thing eve when no one is looking; acting ethically, with honesty and compassion for others The Habit of Convention: Meeting accepted standards in any academic area in order to be understood and to understand others; adhering to appropriate guidelines for the different environments one is in such as school, internship sites, etc. The Habit of Perspectives & Evidence: Addressing questions from multiple viewpoints and using a variety of ways to solve problems and bringing together relevant information, judging the credibility of sources, finding out for one’s self The Habit of Connections: Looking for patterns and for ways in which things fit together in order to bring together diverse material and form solutions Opportunities for Parental Involvement (School Year 2010–11) All staff and all parents participate in student-led conferences involving every student, their advisor and their parent(s) twice a year coinciding with receiving their progress reports. Students follow an agenda that includes reading a reflective essay about their progress, strengths and areas of growth; showing their work to their parents, discussing their grades, and setting goals. Families are invited (and contracted) to attend Exhibition Nights three times a year where students present and share their work in all of their classes. Tenth, eleventh and twelfth graders all present their work in various high stakes presentations before panels, including their parents, community members, and staff, that determine whether or not they deserve to pass and be promoted or graduate. A steering committee of parent leaders meets monthly to plan parent involvement and activities for the school. Full parent meetings take place once a month. One parent representative serves on the ARISE Board of Directors, reporting out to the rest of the Board and helping to set policies and conduct oversight. All new families participate in orientations led by staff, students and parents. All new and returning parents begin the school year with an orientation with their children. All students who are struggling academically have additional family/staff conferences, or SSTs, which include strategies and follow-ups for improvement. The school maintains a website with important dates and other information updated regularly. Student Enrollment by Grade Level (School Year 2010–11) Grade Level Number of Students Grade Level Number of Students Kindergarten 0 Grade 8 0 Grade 1 0 Ungraded Elementary 0 Grade 2 0 Grade 9 76 Grade 3 0 Grade 10 54 Grade 4 0 Grade 11 54 Grade 5 0 Grade 12 32 Grade 6 0 Ungraded Secondary Grade 7 0 Total Enrollment Student Enrollment by Subgroup (School Year 2010–11) 0 216 Group Percent of Total Enrollment Black or African American 5.1% American Indian or Alaska Native 5.1% Asian 0.0% Filipino 0.5% Hispanic or Latino 66.2% Native Hawaiian or Pacific Islander 0.9% White 8.3% Two or More Races 1.4% Socioeconomically Disadvantaged 62.0% English Learners 52.3% Students with Disabilities 1.9% Average Class Size and Class Size Distribution (Secondary) Subject Avg. Class Size 2008–09 Number of Classes* 122 2332 Avg. Class Size 33+ 2009–10 Number of Classes* 122 2332 Avg. Class Size 33+ 2010–11 Number of Classes* 122 2332 33+ English 27.5 2 4 0 28 4 2 0 40.3 1 1 4 Mathematics 28.0 2 6 0 30 2 6 0 26.0 1 6 0 Science 21.0 2 0 0 30 0 6 0 27.8 0 5 0 Social Science 27.5 2 4 0 24 4 2 0 32.2 3 0 2 * Number of classes indicates how many classrooms fall into each size category (a range of total students per classroom). At the secondary school level, this information is reported by subject area rather than grade level. III. School Climate School Safety Plan (School Year 2010–11) ARISE High School shall comply with all applicable provisions of Education Code § 44237, including the requirement that as a condition of employment each new employee must submit two sets of fingerprints to the California Department of Justice for the purpose of obtaining a criminal record summary. A designated school official will assess the results of each teacher’s Live Scan test and determine if the teacher can appropriately teach at the school. Records of students’ immunizations shall be maintained to the extent required for enrollment in non-charter public schools. Students who do not have a full regime of immunizations will be required to get them before starting school. All staff must provide evidence that they are free from tuberculosis. A Mantoux TB is required of all employees who do not have a record of having been tested within the previous four years. The School Director will be responsible for maintaining compliance with § 44237 and all applicable health and safety laws. ARISE High School will adopt and implement a comprehensive set of health, safety, and risk management policies in consultation with the school's insurance carriers before the school opens. These policies will include, but not be limited to: Policies and procedures for response to natural disasters and emergencies, including fires and earthquakes Policies relating to preventing contact with blood-borne pathogens A policy requiring that instructional and administrative staff receive training in emergency response once per year, including appropriate "first responder" training or its equivalent Policies relating to the administration of prescription drugs and other medicines A policy that the school is housed in facilities that have received Fire Marshal approval A policy that the school location and facility will be investigated, inspected, and tested in order to determine that it is free from environmental hazards A policy establishing that the school functions as a drug-, alcohol-, and tobacco- free workplace A policy mandating that all employees working with students who are minors are subject to fingerprinting and must provide the school with a criminal record summary A policy mandating that child abuse, acts of violence, and other improprieties will be duly reported, as required by federal, state, and local laws. A policy establishing the school as a zero-tolerance zone for sexual harassment for all employees, students, and parents. ARISE High School will maintain all insurance, liability, and compensatory coverages and will comply with other regulations, such as fire and safety codes, as required by the federal, state, and city laws. Suspensions and Expulsions Rate* Suspensions School 2008–09 School 2009–10 2 School 2010–11 8 District 2008–09 6 12.9 District 2009–10 n/a District 2010–11 n/a Expulsions 0 0 0 0.1 n/a n/a * The rate of suspensions and expulsions is calculated by dividing the total number of incidents by the total enrollment. IV. School Facilities School Facility Conditions and Planned Improvements (School Year 2011–12) The school is located in a commercial space at the Fruitvale Village Plaza. The facilities are in excellent condition. To enhance student support services, a classroom was divided with a permanent wall and mental health counselors were provided with offices. School Facility Good Repair Status (School Year 2011–12) System Inspected Repair Status Exemplary Good Systems: Gas Leaks, Mechanical/HVAC, Sewer X Interior: Interior Surfaces X Cleanliness: Overall Cleanliness, Pest/ Vermin Infestation X Electrical: Electrical X Restrooms/Fountains: Restrooms, Sinks/ Fountains X Safety: Fire Safety, Hazardous Materials X Structural: Structural Damage, Roofs X External: Playground/School Grounds, Windows/ Doors/Gates/Fences X Overall Rating Fair Poor Repair Needed and Action Taken or Planned Exemplary Note: Cells shaded in black do not require data. V. Teachers Teacher Credentials Teachers With Full Credential School 2008–09 School 2009–10 6 10 School 2010–11 10 District 2010–11 N/A Without Full Credential 1 Teaching Outside Subject Area of Competence (with full credential) 0 0 0 N/A 0 0 N/A Teacher Misassignments and Vacant Teacher Positions Indicator 2009–10 2010–11 2011–12 Misassignments of Teachers of English Learners 0 0 0 Total Teacher Misassignments* 0 0 0 Vacant Teacher Positions 0 0 0 Note: “Misassignments” refers to the number of positions filled by teachers who lack legal authorization to teach that grade level, subject area, student group, etc. * Total Teacher Misassignments includes the number of Misassignments of Teachers of English Learners. Core Academic Classes Taught by Highly Qualified Teachers (School Year 2010–11) The Federal Elementary and Secondary Education Act (ESEA), also known as No Child Left Behind (NCLB), requires that core academic subjects be taught by Highly Qualified Teachers, defined as having at least a bachelor’s degree, an appropriate California teaching credential, and demonstrated core academic subject area competence. For more information, see the CDE Improving Teacher and Principal Quality Web page at: http://www.cde.ca.gov/nclb/sr/tq/ Location of Classes Percent of Classes In Core Academic Subjects Taught by Highly Qualified Teachers Percent of Classes In Core Academic Subjects Not Taught by Highly Qualified Teachers This School 100.00% 0.00% All Schools in District 100.00% 0.00% High-Poverty Schools in District 0.00% 0.00% Low-Poverty Schools in District 0.00% 0.00% Note: High-poverty schools are defined as those schools with student eligibility of approximately 40 percent or more in the free and reduced price meals program. Low-poverty schools are those with student eligibility of approximately 25 percent or less in the free and reduced price meals program. VI. Support Staff Academic Counselors and Other Support Staff (School Year 2010–11) Number of FTE* Assigned to School Title Academic Counselor 1.0 Counselor (Social/Behavioral or Career Development) 0 Library Media Teacher (librarian) 0 Library Media Services Staff (paraprofessional) 0 Psychologist 0 Social Worker 0 Nurse 0 Speech/Language/Hearing Specialist 0.05 Resource Specialist (non-teaching) .0125 Other 0 Average Number of Students per Academic Counselor 200 Note: Cells shaded in black do not require data. * One Full-Time Equivalent (FTE) equals one staff member working full-time; one FTE could also represent two staff members who each work 50 percent of full-time. VII. Curriculum and Instructional Materials Quality, Currency, Availability of Textbooks and Instructional Materials (School Year 2011–12) This section describes whether the textbooks and instructional materials used at the school are from the most recent adoption; whether there are sufficient textbooks and instruction materials for each student; and information about the school’s use of any supplemental curriculum or non-adopted textbooks or instructional materials. Year and month in which data were collected: ____Jan 2011________________ Core Curriculum Area Textbooks and instructional materials/year of adoption From most recent adoption? Percent students lacking own assigned copy Reading/Language Arts Excellent Y 0 Mathematics Excellent Y 0 Science Excellent Y 0 History-Social Science Excellent Y 0 Foreign Language Excellent Y 0 Health NA Y 0 Visual and Performing Arts NA Y 0 Science Laboratory Equipment (grades 9-12) Good Y 0 VIII. School Finances Expenditures Per Pupil and School Site Teacher Salaries (Fiscal Year 2009–10) Level School Site Total Expenditures Per Pupil $10,425 Expenditures Per Pupil (Supplemental / Restricted) $1,592 Expenditures Per Pupil (Basic / Unrestricted) $8,833 Average Teacher Salary $46,000 District $53,964 Percent Difference – School Site and District 17% State Percent Difference – School Site and State $5,455 36% $69,207 34% Note: Cells shaded in black do not require data. Supplemental/Restricted expenditures come from money whose use is controlled by law or by a donor. Money that is designated for specific purposes by the district or governing board is not considered restricted. Basic/unrestricted expenditures are from money whose use, except for general guidelines, is not controlled by law or by a donor. For detailed information on school expenditures for all districts in California, see the CDE Current Expense of Education & Per-pupil Spending Web page at http://www.cde.ca.gov/ds/fd/ec/. For information on teacher salaries for all districts in California, see the CDE Certificated Salaries & Benefits Web page at http://www.cde.ca.gov/ds/fd/cs/. To look up expenditures and salaries for a specific school district, see the EdData Web site at: http://www.ed-data.org. Types of Services Funded (Fiscal Year 2010–11) ARISE provides many supplemental services and programs that are paid for with categorical or other sources. All students at ARISE take college courses in Visual and Performing Arts and Physical Education. With the categorical funding for the arts, we have been able to support the continuation of these college courses during our Intersession. Students also participate in Physical Education activities at the Jack London Aquatic Center courtesy of outside funding or in-kind trades. We have a rowing crew, dragon boat racing team, and swimming classes. Students at ARISE also receive counseling services through a locally funded Mental Health Consortium. Another important aspect at ARISE that relies on categorical or outside funding is our extensive professional development program. ARISE's charter states that we promote and support emerging teacher development. Thus, every teacher at ARISE participates in 21 days of professional development, has a teacher coach and mentor. Teacher and Administrative Salaries (Fiscal Year 2009–10) Category District Amount State Average For Districts In Same Category Beginning Teacher Salary $39,456 $42,017 Mid-Range Teacher Salary $54,328 $67,294 Highest Teacher Salary $70,934 $86,776 Average Principal Salary (Elementary) $91,546 $108,534 Average Principal Salary (Middle) $92,424 $112,893 Average Principal Salary (High) $100,417 $123,331 Superintendent Salary $265,600 $226,417 28.00% 38.00% 7.00% 5.00% Percent of Budget for Teacher Salaries Percent of Budget for Administrative Salaries Note: For detailed information on salaries, see the CDE Certificated Salaries & Benefits Web page at http://www.cde.ca.gov/ds/fd/cs/. IX. Student Performance Standardized Testing and Reporting Program The Standardized Testing and Reporting (STAR) Program consists of several key components, including: California Standards Tests (CSTs), which include English-language arts (ELA) and mathematics in grades two through eleven; science in grades five, eight, and nine through eleven; and history-social science in grades eight, and nine through eleven. California Modified Assessment (CMA), an alternate assessment that is based on modified achievement standards in ELA for grades three through eleven; mathematics for grades three through seven, Algebra I, and Geometry; and science in grades five and eight, and Life Science in grade ten. The CMA is designed to assess those students whose disabilities preclude them from achieving grade-level proficiency on an assessment of the California content standards with or without accommodations. California Alternate Performance Assessment (CAPA), includes ELA and mathematics in grades two through eleven, and science for grades five, eight, and ten. The CAPA is given to those students with significant cognitive disabilities whose disabilities prevent them from taking either the CSTs with accommodations or modifications or the CMA with accommodations. The assessments under the STAR Program show how well students are doing in relation to the state content standards. On each of these assessments, student scores are reported as performance levels. For detailed information regarding the STAR Program results for each grade and performance level, including the percent of students not tested, see the CDE STAR Results Web site at http://star.cde.ca.gov. Standardized Testing and Reporting Results for All Students – Three-Year Comparison Percent of Students Scoring at Proficient or Advanced (meeting or exceeding the state standards) Subject School 2008– 09 EnglishLanguage Arts 2009– 10 District 2010– 11 2008– 09 2009– 10 State 2010– 11 2008– 09 2009– 10 2010– 11 13% 17% 16% 38% 43% 45% 49% 52% 54% Mathematics 3% 4% 8% 39% 44% 46% 46% 48% 50% Science 4% 3% 6% 34% 41% 46% 50% 54% 57% History-Social Science 3% 2% 0% 25% 27% 32% 41% 44% 48% Note: Scores are not shown when the number of students tested is ten or less, either because the number of students in this category is too small for statistical accuracy or to protect student privacy. Standardized Testing and Reporting Results by Student Group – Most Recent Year Percent of Students Scoring at Proficient or Advanced Group English- Language Arts Mathematics Science History- Social Science All Students in the LEA 45% 46% 46% 32% All Students at the School 16% 8% 6% 0% Male 14% 11% 13% 0% Female 18% 6% 0% 0% Black or African American 0% 0% 0% 0% American Indian or Alaska Native 0% 0% 0% 0% 0% 0% 0% 0% 16% 9% 6% 0% White 0% 0% 0% 0% Two or More Races 0% 0% 0% 0% Socioeconomically Disadvantaged 13% 6% 6% 0% English Learners 17% 9% 6% 0% Asian Filipino Hispanic or Latino Native Hawaiian or Pacific Islander Students with Disabilities Students Receiving Migrant Education Services Note: Scores are not shown when the number of students tested is ten or less, either because the number of students in this category is too small for statistical accuracy or to protect student privacy. California High School Exit Examination The California High School Exit Examination (CAHSEE) is primarily used as a graduation requirement. However, the grade ten results of this exam are also used to establish the percentages of students at three proficiency levels (not proficient, proficient, or advanced) in ELA and mathematics to compute AYP designations required by the federal ESEA, also known as NCLB. For detailed information regarding CAHSEE results, see the CDE CAHSEE Web site at http://cahsee.cde.ca.gov/. California High School Exit Examination Results for All Grade Ten Students – Three-Year Comparison (if applicable) Percent of Students Scoring at Proficient or Advanced Subject School 2008– 2009– District 2010– 2008– 2009– State 2010– 2008– 2009– 2010– 09 10 11 09 10 11 09 10 11 EnglishLanguage Arts 15% 7% 35% 34% 35% 40% 52% 54% 59% Mathematics 15% 13% 42% 37% 36% 40% 53% 54% 56% Note: Scores are not shown when the number of students tested is ten or less, either because the number of students in this category is too small for statistical accuracy or to protect student privacy. California High School Exit Examination Grade Ten Results by Student Group – Most Recent Year (if applicable) English-Language Arts Group Not Proficient Mathematics Proficient Advanced Not Proficient Proficient Advanced All Students in the LEA 60% 21% 18% 60% 26% 14% All Students at the School 65% 24% 10% 58% 28% 14% Male 50% 35% 15% 30% 40% 30% Female 76% 17% 7% 77% 20% 3% Black or African American 0% 0% 0% 0% 0% 0% American Indian or Alaska Native 0% 0% 0% 0% 0% 0% Asian 0% 0% 0% 0% 0% 0% Filipino 0% 0% 0% 0% 0% 0% 66% 25% 9% 53% 31% 16% Native Hawaiian or Pacific Islander 0% 0% 0% 0% 0% 0% White 0% 0% 0% 0% 0% 0% Two or More Races 0% 0% 0% 0% 0% 0% Socioeconomically Disadvantaged 66% 22% 12% 61% 24% 15% English Learners 85% 0% 15% 69% 8% 23% 0% 0% 0% 0% 0% 0% Hispanic or Latino Students with Disabilities Students Receiving Migrant Education Services 0% 0% 0% 0% 0% 0% Note: Scores are not shown when the number of students tested is ten or less, either because the number of students in this category is too small for statistical accuracy or to protect student privacy. California Physical Fitness Test Results (School Year 2010–11) The California Physical Fitness Test (PFT) is administered to students in grades five, seven, and nine only. This table displays by grade level the percent of students meeting the fitness standards for the most recent testing period. For detailed information regarding this test, and comparisons of a school’s test results to the district and state, see the CDE PFT Web page at http://www.cde.ca.gov/ta/tg/pf/. Percent of Students Meeting Fitness Standards Grade Level Four of Six Standards Five of Six Standards Six of Six Standards 5 7 9 Note: Scores are not shown when the number of students tested is ten or less, either because the number of students in this category is too small for statistical accuracy or to protect student privacy. X. Accountability Academic Performance Index The Academic Performance Index (API) is an annual measure of state academic performance and progress of schools in California. API scores range from 200 to 1,000, with a statewide target of 800. For detailed information about the API, see the CDE API Web page at http://www.cde.ca.gov/ta/ac/ap/. Academic Performance Index Ranks – Three-Year Comparison This table displays the school’s statewide and similar schools’ API ranks. The statewide API rank ranges from 1 to 10. A statewide rank of 1 means that the school has an API score in the lowest ten percent of all schools in the state, while a statewide rank of 10 means that the school has an API score in the highest ten percent of all schools in the state. The similar schools API rank reflects how a school compares to 100 statistically matched “similar schools.” A similar schools rank of 1 means that the school’s academic performance is comparable to the lowest performing ten schools of the 100 similar schools, while a similar schools rank of 10 means that the school’s academic performance is better than at least 90 of the 100 similar schools. API Rank Statewide 2008 2009 1 2010 1 1 Similar Schools N/A 1 1 Academic Performance Index Growth by Student Group – Three-Year Comparison Group Actual API Change 2008–09 All Students at the School Actual API Change 2009–10 Actual API Change 2010–11 20 -23 86 34 -36 86 Black or African American American Indian or Alaska Native Asian Filipino Hispanic or Latino Native Hawaiian or Pacific Islander White Two or More Races N/D Socioeconomically Disadvantaged English Learners 46 Students with Disabilities Note: “N/D” means that no data were available to the CDE or LEA to report. “B” means the school did not have a valid API Base and there is no Growth or target information. “C” means the school had significant demographic changes and there is no Growth or target information. Academic Performance Index Growth by Student Group – 2011 Growth API Comparison This table displays, by student group, the number of students included in the API and the 2011 Growth API at the school, LEA, and state level. 2011 Growth API Group Number of Students School All Students at the School 160 Black or African American 2 569 Number of Students LEA Number of Students State 26,718 726 4,683,676 778 8,537 652 317,856 696 American Indian or Alaska Native 1 95 703 33,774 733 Asian 0 4,034 828 398,869 898 Filipino 1 247 810 123,245 859 9,893 698 2,406,749 729 Hispanic or Latino 151 569 Native Hawaiian or Pacific Islander 0 311 678 26,953 764 White 1 2,133 911 1,258,831 845 Two or More Races 2 458 853 76,766 836 Socioeconomically Disadvantaged 100 16,731 694 2,731,843 726 English Learners 152 11,108 702 1,521,844 707 2,844 539 521,815 595 Students with Disabilities 526 0 Adequate Yearly Progress The federal ESEA requires that all schools and districts meet the following Adequate Yearly Progress (AYP) criteria: Participation rate on the state’s standards-based assessments in ELA and mathematics Percent proficient on the state’s standards-based assessments in ELA and mathematics API as an additional indicator Graduation rate (for secondary schools) For detailed information about AYP, including participation rates and percent proficient results by student group, see the CDE AYP Web page at http://www.cde.ca.gov/ta/ac/ay/. Adequate Yearly Progress Overall and by Criteria (School Year 2010–11) AYP Criteria School District Made AYP Overall Yes No Met Participation Rate - English-Language Arts Yes Yes Met Participation Rate - Mathematics Yes Yes Met Percent Proficient - English-Language Arts Yes No Met Percent Proficient - Mathematics Yes No Met API Criteria Yes Yes Met Graduation Rate N/A No Federal Intervention Program (School Year 2011–12) Schools and districts receiving federal Title I funding enter Program Improvement (PI) if they do not make AYP for two consecutive years in the same content area (ELA or mathematics) or on the same indicator (API or graduation rate). After entering PI, schools and districts advance to the next level of intervention with each additional year that they do not make AYP. For detailed information about PI identification, see the CDE PI Status Determinations Web page: http://www.cde.ca.gov/ta/ac/ay/tidetermine.asp. Indicator Program Improvement Status First Year of Program Improvement Year in Program Improvement School District In PI In PI 2010-2011 2004-2005 Year 1 Year 3 Number of Schools Currently in Program Improvement 76 Percent of Schools Currently in Program Improvement 58.0% Note: Cells shaded in black do not require data. XI. School Completion and Postsecondary Preparation Admission Requirements for California’s Public Universities University of California Admission requirements for the University of California (UC) follow guidelines set forth in the Master Plan, which requires that the top one-eighth of the state’s high school graduates, as well as those transfer students who have successfully completed specified college course work, be eligible for admission to the UC. These requirements are designed to ensure that all eligible students are adequately prepared for University-level work. For general admissions requirements, please visit the UC Admissions Information Web page at http://www.universityofcalifornia.edu/admissions/. (Outside source) California State University Eligibility for admission to the California State University (CSU) is determined by three factors: Specific high school courses Grades in specified courses and test scores Graduation from high school Some campuses have higher standards for particular majors or students who live outside the local campus area. Because of the number of students who apply, a few campuses have higher standards (supplementary admission criteria) for all applicants. Most CSU campuses have local admission guarantee policies for students who graduate or transfer from high schools and colleges that are historically served by a CSU campus in that region. For admission, application, and fee information see the CSU Web page at http://www.calstate.edu/admission/admission.shtml. (Outside source) Dropout Rate and Graduation Rate School Indicator Dropout Rate (1-year) 2007– 08 2008– 09 0.0 9.8 Graduation Rate District 2009– 10 7.4 2007– 08 2008– 09 State 2009– 10 2007– 08 2008– 09 2009– 10 7.6 10.8 8.9 4.9 5.7 4.6 67.60 59.20 58.37 80.21 78.59 80.44 Note: The National Center for Education Statistics graduation rate as reported in AYP is provided in this table. Completion of High School Graduation Requirements This table displays, by student group, the percent of students who began the 2010–11 school year in grade twelve and were a part of the school’s most recent graduating class, meeting all state and local graduation requirements for grade twelve completion, including having passed both the ELA and mathematics portions of the CAHSEE or received a local waiver or state exemption. Graduating Class of 2011 Group School District State All Students 97.9 N/D Black or African American 0.05 N/D American Indian or Alaska Native 0 N/D Asian 0 N/D Filipino 0 N/D Hispanic or Latino 97.9 N/D Native Hawaiian or Pacific Islander 0.05 N/D White 0 N/D Two or More Races 0 N/D Socioeconomically Disadvantaged 81 N/D English Learners 70 N/D Students with Disabilities 0 N/D Note: “N/D” means that no data were available to the CDE or LEA to report. Career Technical Education Programs (School Year 2010–11) ARISE High School does not offer CTE programs. Career Technical Education Participation (School Year 2010–11) Measure CTE Program Participation Number of pupils participating in CTE ARISE High School does not offer CTE programs. Percent of pupils completing a CTE program and earning a high school diploma ARISE High School does not offer CTE programs. Percent of CTE courses sequenced or articulated between the school and institutions of postsecondary education ARISE High School does not offer CTE programs. Courses for University of California and/or California State University Admission UC/CSU Course Measure Percent 2010-11 Students Enrolled in Courses Required for UC/CSU Admission 2009-10 Graduates Who Completed All Courses Required for UC/CSU Admission 94.9% 100.0% Advanced Placement Courses (School Year 2010–11) Subject Number of AP Courses Offered* Computer Science 0 English 0 Fine and Performing Arts 0 Foreign Language 0 Mathematics 0 Science 0 Social Science 0 Percent of Students In AP Courses All courses 0 0.0% Note: Cells shaded in black do not require data. *Where there are student course enrollments. XII. Instructional Planning and Scheduling Professional Development This section provides information on the annual number of school days dedicated to staff development for the most recent three-year period. Teachers at ARISE receive on-going support and training through a minimum of 20 professional development days each year. Professional development is offered through the Coalition of Essential Schools (CES), REACH Teacher Credentialing Program, Expeditionary Learning Program, peer observation, instructional coaching, and through leadership opportunities. The instructional leadership at ARISE also receives ongoing mentorship and training, through partnerships with the California Charter Schools Association, the Coalition of Essential Schools and the Oakland Unified School District. Staff development and professional collaboration aligned with standards-based instructional materials: All staff receives staff development on how to teach reading and writing across the curriculum. All staff collaborates in grade level teams to plan and assist students in completing literacyrich inter-disciplinary projects such as a research paper for science class or literature circles on a historical topic. All staff are trained in and facilitate weekly Socratic Seminars around short pieces of text to help students develop their close reading skills. All staff participates in self-assessments and external assessments of their strengths and areas of need in order to best prepare whole group, small group, and individual professional development plans. ARISE’s ELA teachers are a part of a national network of educators with whom they participate in professional development, conduct inter-school peer visitation, and share curriculum and ideas. ARISE High Oakland Unified School Accountability Report Card, 2010-2011 Provided by the Ed-Data Partnership For more information visit www.ed-data.org
