Peptide Mass Fingerprinting
advertisement
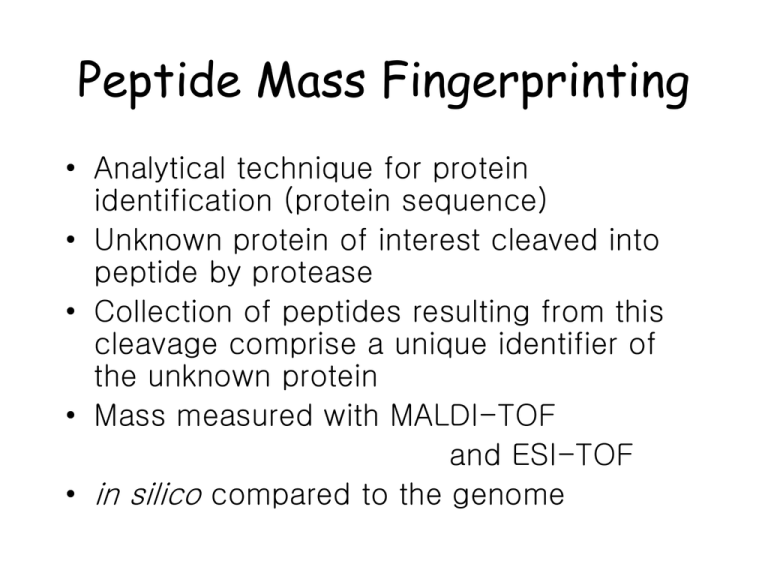
Peptide Mass Fingerprinting • Analytical technique for protein identification (protein sequence) • Unknown protein of interest cleaved into peptide by protease • Collection of peptides resulting from this cleavage comprise a unique identifier of the unknown protein • Mass measured with MALDI-TOF and ESI-TOF • in silico compared to the genome • Computer programs translate the known genome of the organism into proteins • Theoretically cut the proteins into peptides with the same protease (ex.Trypsin: K or R) • Calculate the absolute masses of the peptides from each protein • the masses of the peptides of the unknown protein vs the theoretical peptide masses of each protein encoded in the genome • Results statistically analyzed to find the best match Peptide Mass Fingerprinting • Advantage : only the masses of the peptides have to be known • Disadvantage : - the protein sequence has to be present in the database of interest - most PMF algorithms assume the peptides come from a single protein Sample preparation • SDS-PAGE →chemical modification • Protein cleavage : trypsin, chemotrypsin, or V8 protease • Sample : protease = 50 : 1 • Peptides extracted with acetonitrile and dried under vacuum. • Peptides dissolved in a small amount of distilled water • Mass spectrometric analysis • Sample generation (시료) – Origin of sample • hypothesis, organism, environment, preparation, paper citations • Sample processing (시료 전처리) – Gels (1D/2D), columns, other methods • images, gel type and ranges, band/spot coordinates • stationary and mobile phases, flow rate, temperature, fraction details • Mass Spectrometry (질량 분석기) • machine type, ion source, voltages • In Silico analysis (데이터 분석) • peak lists, database name + version, partial sequence, search parameters, search hits, accession numbers In Gel Digestion & Mass Spectrometry Trypsin Digest Cut out 2D-Gel Spot Protein Peptides Peptide Mass Fingerprinting N K K R K K K R K R Trypsin K Protein N K K K R R R R C K K R C Tryptic peptide mixture. Masses measured by MS. Every peptide has a basic Cterminus. A protein can be identified in a database by matching masses of a subset of the tryptic peptides against calculated values. intact protein enzyme peptide fragments MEMEKEFEQIDKSGSWAAIYQDIRHEASDFPCRVAKLPKNKNRNRYRDVS PFDHSRIKLHQEDNDYINASLIKMEEAQRSYILTQGPLPNTCGHFWEMVW EQKSRGVVMLNRVMEKGSLKCAQYWPQKEEKEMIFEDTNLKLTLISEDIK SYYTVRQLELENLTTQETREILHFHYTTWPDFGVPESPASFLNFLFKVRE SGSLSPEHGPVVVHCSAGIGRSGTFCLADTCLLLMDKRKDPSSVDIKKVL LEMRKFRMGLIQTADQLRFSYLAVIEGAKFIMGDSSVQDQWKELSHEDLE PPPEHIPPPPRPPKRILEPHNGKCREFFPNHQWVKEETQEDKDCPIKEEK GSPLNAAPYGIESMSQDTEVRSRVVGGSLRGAQAASPAKGEPSLPEKDED HALSYWKPFLVNMCVATVLTAGAYLCYRFLFNSNT Mass spectrometric analysis • Digested protein analyzed with different types of mass spectrometers ; ESI-TOF or MALDI-TOF (allows higher sample throughput and several proteins analyzed in a single experiment) • A small fraction of the peptide (usually 1 microliter or less) is pipetted onto a MALDI target • A chemical called a ‘matrix’ is added to the peptide mix • Matrix molecules required for the desorption of the peptide molecules • matrix : a chemical with the correct properties that absorbs light, and so energy, at the wavelength of the laser used • Matrix and peptide molecules cocrystallize on the MALDI target • Analyzed. Computational analysis • Peak list : the mass spectrometrical analysis produces a list of molecular weights • Peptide masses compared to huge databases which contain protein sequence information • MS-Fit, Mascot, Peptident and Profound • Software programs cut all these proteins into peptides with the same enzyme used in the chemical cleavage (ex. trypsin) MALDI-TOF MS Data acquisition -Data Search [profound; Mascot; MS-Fit] - • Absolute mass of all these peptides is then theoretically calculated • Comparison between the peak list of measured peptide masses vs all the masses from the calculated peptides • Results statistically analyzed • Possible matches returned in a results table Peptide Mass Fingerprinting 2D-Gel Database “Spot removal” In Silico Digestion In Gel Digestion MS 848.1 1272.5 492.6 883.2 2978.9 812.6 1432.3 3127.1 996.8 702.4 164.9 2748.2 Is identical to 848.3 1272.7 493.2 882.6 2978.3 364.1 948.9 3128.8 3514.2 2837.1 263.9 147.4 1429.7 199.6 142.3 640.8 1. MALDI-TOF MS spectrum Voyager Spec #1=>NR(2.00)[BP = 1567.2, 61395] 3.1E+4 0 901.0 1236.8 1908.4 M ass (m/z ) RHPYFYAPELLYYANK MPCTEDYLSLILNR 1572.6 GLVLIAFSQYLQQCPFDEHVK 10 RPCFSALTPDETYVPK 20 RHPEYAVSVLLR LGEYGFQNALIVR 30 YLYEIAR % Inte ns ity 40 DAFLGSFLYEYEYSR 50 2244.2 0 2580.0 2. Data Search (data base sever: NCBI & Mascot) Voyager Spec #1=>NR(2.00)[BP = 1567.2, 61395] 3.1E+4 50 GLVLIAFSQYLQQCPFDEHVK RHPYFYAPELLYYANK RPCFSALTPDETYVPK MPCTEDYLSLILNR DAFLGSFLYEYEYSR 20 RHPEYAVSVLLR LGEYGFQNALIVR 30 YLYEIAR % Inte ns ity 40 10 0 901.0 1236.8 1572.6 1908.4 M ass (m/z ) 3. Identification : Bovine Serum Albumin 2244.2 0 2580.0 • http://www.massspec.co.nz/submission/pmf_ss.pdf • http://www.matrixscience.com/cgi/m aster_results.pl?file=../data/F981122. dat

