Microarray technology and analysis of gene expression data
advertisement
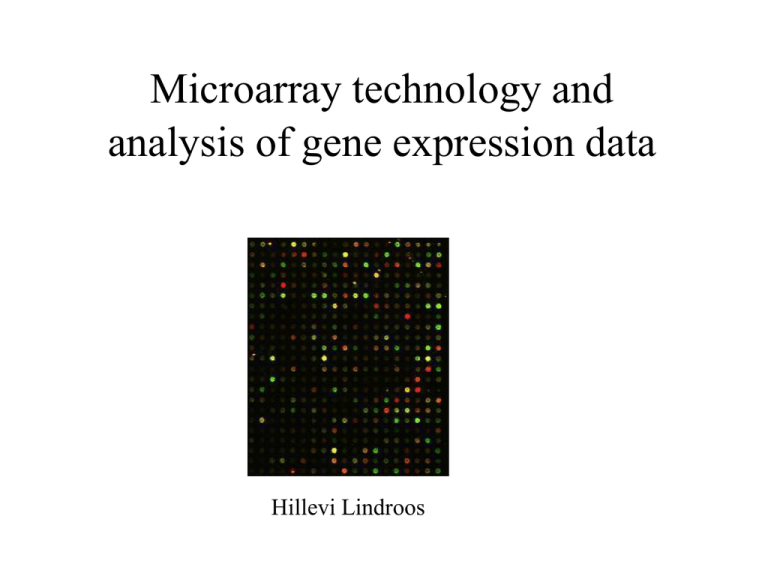
Microarray technology and analysis of gene expression data Hillevi Lindroos Introduction to microarray technology • Technique for studying gene expression for thousands of genes simultaneously. • Study gene regulation, effects of treatments, differences between healthy and diseased cells... • Comparative Genome Hybridization: - gene content in related strains/species - gene dosage in cancer cells • Microarray: glass slide with spots, each containing DNA from one gene Two-colour spotted microarrays Spot = PCR-product (~500 bp) from one gene or long oligonucleotide (~50 bp) Differential expression (two samples compared) Experimental procedure: 1. Isolate RNA from 2 samples (experiment and control). 2. Reverse transcribe to cDNA with fluorescently labelled nucleotides, e.g. Cy3-dCTP (control) or Cy5-dCTP (experiment). 3. Mix and hybridize to microarray. 4. Laser scan: measure fluorescent intensities Red and green images superimposed: In principle... Red spot: up-regulated gene, ratio >1 Green spot: down-regulated gene, ratio <1 Yellow spot: no differential expression, ratio =1 Control RT + green dye mixing equal amounts of cDNA gene A RT + red dye competitive hybridization Sample (e.g. heat shock) Up-regulation Microarray Red dot in image Why differential expression? Fluorescent intensities do not directly correspond to mRNA concentrations, due to: • different shapes and densities of spots • different hybridization properties between genes • different amounts of dye incorporation between genes Compare intensities (expression) from two samples. Data processing and analysis 1. Image analysis Locate spots in image Quantify fluorescence intensity (spot + background) Mean / median of pixel intensities 2. Background correction – local background for each spot, or global for whole array – assuming additive background: Spot intensity = True intensity + Background Output Cy5 (R) and Cy3 (G) intensities Ratio = R/G ~ [mRNA_experiment] / [mRNA_control] Up-regulated genes: ratio >1 Down-regulated genes: ratio= 0-1 Assymetry! Use logarithm! M = log2(ratio) is symmetrically distributed around 0 Upregulated 2 times: ratio= 2, M= 1 Downregulated 2 times: ratio= 0.5, M= -1 3. Normalization: correction of systematic errors (dye bias) • different amounts of control and experiment samples • different fluorescent intensities of Cy3 and Cy5 • different labelling and detection efficiencies Plot of Cy5 intensity (R) vs Cy3 intensity (G): Dye bias: Most genes seem to be upregulated (higher Cy5 than Cy3 intensity). Corrected for by scaling Cy5 values with total_Cy3/total_Cy5. Assumes most genes unaffected by treatment. Intensity dependent dye bias Dye bias may depend on total spot intensity A (A =½(log2R+log2G)), position on array, print-tip… Correction: Mnormalized = M – Mtrend(A) Identify differentially expressed genes •Simple: cutoff (e.g. |M| > 1) •Better: statistical test, e.g. t-test (replicate spots or repeated experiments) => Significance –Unstable mRNAs may have high ratios – and high variation! –Weak spots: small difference in signal may be big relative difference (high ratio). Affymetrix genchips Spots = 25 bp oligonucleotides Pairs of perfectly matching probe + probe with 1 mismatch for each gene One sample per array Radioactive labelling Expression level computed from difference in intensity between matching and mis-matching probe Expression profiles Plot expression over a series of experiment (e.g. time series) Expression profiles 3 M = log2(R/G) 2 1 0 0 1 2 3 -1 -2 -3 -4 Time 4 5 6 Gene_A Gene_B Clustering expression profiles Analyze multiple experiments to identify common patterns of gene expression Similar function – similar expression (co-regulation) Goals: •Identify regulatory motifs •Infer function of unknown genes •Distinguish cell types, e.g. tumors (cluster arrays) Hierarchical clustering Expression profile -> vector Compute similarity between expression profiles (e.g. correlation coefficient) Successively join the most similar genes to clusters, and clusters to superclusters Serum stimulation of human fibroblasts, time series. A: cholesterol biosynthesis B: cell cycle C: immediate-early response D: signaling and angiogenesis E: wound healing Distance: correlation coefficient Agglomeration: average linkage from: Eisen et al., 1998, PNAS 95(25): 14863-14868 Clustering of arrays: classification of cancer cells. From Chen et al. (2002). Mol Biol Cell 13(6):1929-39 Exercise: Normalization (Excel): R-G plot M-A plot most up- and downregulated genes

