STAT 416 Homework 1
advertisement
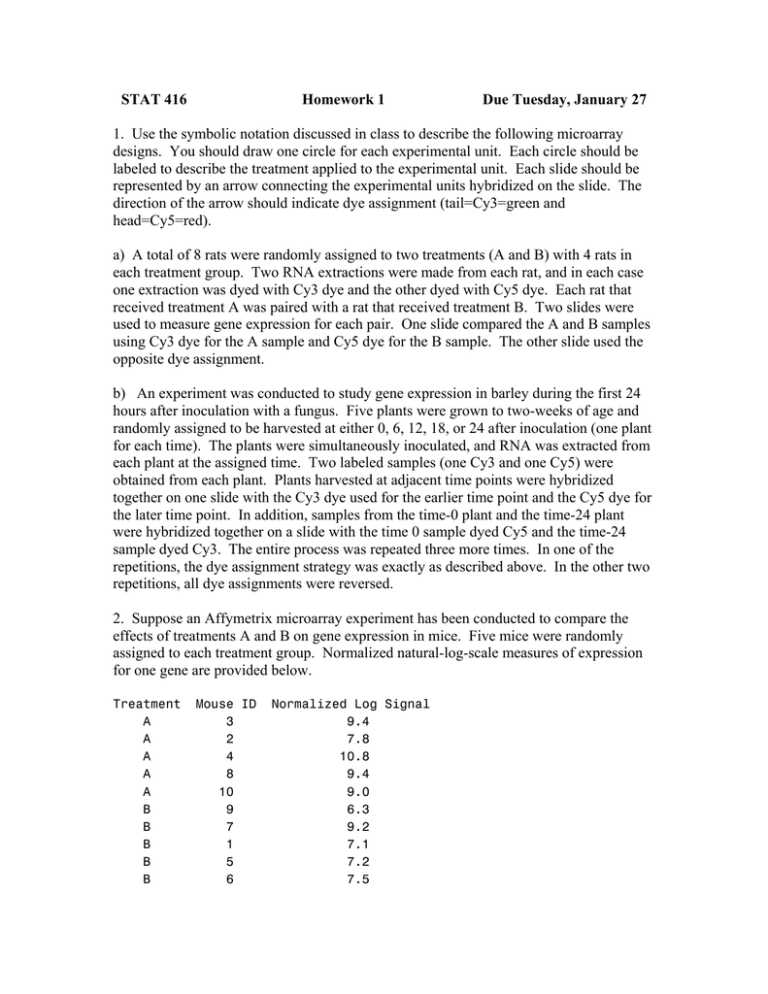
STAT 416 Homework 1 Due Tuesday, January 27 1. Use the symbolic notation discussed in class to describe the following microarray designs. You should draw one circle for each experimental unit. Each circle should be labeled to describe the treatment applied to the experimental unit. Each slide should be represented by an arrow connecting the experimental units hybridized on the slide. The direction of the arrow should indicate dye assignment (tail=Cy3=green and head=Cy5=red). a) A total of 8 rats were randomly assigned to two treatments (A and B) with 4 rats in each treatment group. Two RNA extractions were made from each rat, and in each case one extraction was dyed with Cy3 dye and the other dyed with Cy5 dye. Each rat that received treatment A was paired with a rat that received treatment B. Two slides were used to measure gene expression for each pair. One slide compared the A and B samples using Cy3 dye for the A sample and Cy5 dye for the B sample. The other slide used the opposite dye assignment. b) An experiment was conducted to study gene expression in barley during the first 24 hours after inoculation with a fungus. Five plants were grown to two-weeks of age and randomly assigned to be harvested at either 0, 6, 12, 18, or 24 after inoculation (one plant for each time). The plants were simultaneously inoculated, and RNA was extracted from each plant at the assigned time. Two labeled samples (one Cy3 and one Cy5) were obtained from each plant. Plants harvested at adjacent time points were hybridized together on one slide with the Cy3 dye used for the earlier time point and the Cy5 dye for the later time point. In addition, samples from the time-0 plant and the time-24 plant were hybridized together on a slide with the time 0 sample dyed Cy5 and the time-24 sample dyed Cy3. The entire process was repeated three more times. In one of the repetitions, the dye assignment strategy was exactly as described above. In the other two repetitions, all dye assignments were reversed. 2. Suppose an Affymetrix microarray experiment has been conducted to compare the effects of treatments A and B on gene expression in mice. Five mice were randomly assigned to each treatment group. Normalized natural-log-scale measures of expression for one gene are provided below. Treatment A A A A A B B B B B Mouse ID 3 2 4 8 10 9 7 1 5 6 Normalized Log Signal 9.4 7.8 10.8 9.4 9.0 6.3 9.2 7.1 7.2 7.5 a) Write down a model for this data using notation similar to that used in class. Define each term in your model. b) Write down a null hypothesis (using terms from your model) that says that this gene is NOT differentially expressed. c) If we assume that data are independent and approximately normally distributed with variance that is the same for both treatment groups, we can test the hypothesis in (b) using a two-sample t-test. Conduct such a t-test using this data. Provide a test statistic, its degrees of freedom, a p-value, and a written explanation of what this p-value means in this case. d) Estimate the difference between treatment means and provide a 95% confidence interval for the difference in treatment means. e) It is common to talk about fold changes in microarray data analysis because treatment effects are assumed to be multiplicative. For example suppose a gene expresses a level x when a plant is treated with a control substance and at level 1.7x when a plant is treated with a virus. Then the virus is said to cause a 1.7-fold change in expression. Multiplicative effects on the original scale become additive on the log scale. For example, compare log x to log 1.7x. Because log 1.7x = log 1.7 + log x, we can see that the effect of the virus relative to control is to add log 1.7 to the log-scale expression. We analyze data on the log scale because statistical methods are designed to detect additive treatment effects. For interpretation purposes, it is often nice to convert an estimated difference (e.g., log 1.7x - log x = log 1.7) back to a fold change (1.7). Convert your answers in (d) to an estimated fold change and a 95% confidence interval for the fold change. 3. Suppose an Affymetrix microarray experiment has been conducted to compare the effects of treatments A, B, and C on gene expression in mice. Five mice were randomly assigned to each treatment group. Normalized natural-log-scale measures of expression for one gene are provided below. Treatment A A A A A B B B B B C C C C C Mouse ID 15 6 12 11 3 8 10 13 5 2 4 1 9 7 14 Normalized Log Signal 5.9 3.8 4.2 4.0 5.5 4.9 6.9 4.5 5.5 4.1 3.4 5.6 6.7 4.0 4.6 a) Write down a model for this data using notation similar to that used in class. Define each term in your model. b) Write down a null hypothesis (using terms from your model) that says that mean expression of this gene is the same for all three treatments. c) If we assume that data are independent and approximately normally distributed with variance that is the same for all treatment groups, we can test the hypothesis in (b) using an F-test. Conduct such an F-test using this data. Provide a test statistic, its degrees of freedom, a p-value, and a written explanation of what this p-value means in this case. 4. Why do non-differentially expressed genes sometimes yield small p-values? Anytime there is variation not due to treatment (which is pretty much all the time), small p-values may result by chance. To understand how this can happen, consider the following gene's log-scale expression values for 10 experimental units when the experimental units are in their natural (untreated) state. 3.8 4.1 4.6 5.7 6.1 6.7 6.9 7.2 7.9 8.9 Suppose that an experiment is planned to compare the expression of this gene for two treatments A and B. Suppose that the treatments have no effect on expression whatsoever so that no matter how treatments get assigned to the experimental units, the 10 numbers above will end up being the log-scale expression values. Suppose that during random assignment of treatments to experimental units, the five experimental units with the lowest values happen to get assigned to treatment A and the five experimental units with highest values happen to get assigned to treatment B. (This random assignment is as likely as any other.) a) With this random assignment, what p-value will result when a two-sample t-test is conducted? b) If small p-values can result even when genes aren't differentially expressed, of what use are p-values; i.e., why should we use p-values to decide which genes are differentially expressed?

