Power Point Presentation - National Statistical Service
advertisement
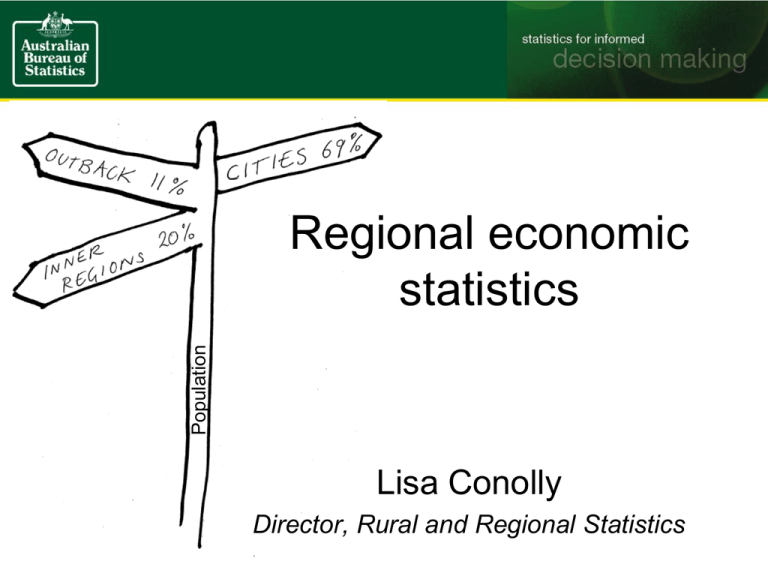
Population Regional economic statistics Lisa Conolly Director, Rural and Regional Statistics Overview • • • • • About regional statistics at ABS Why regional economic data is needed ? Which regions ? What do we know (and not know) ? Future directions National Regional Profile Overview • • • • • About regional statistics at ABS Why regional economic data is needed? Which regions ? What do we know (and not know) ? Future directions Regional economic data uses • • • • • Wellbeing - economic outcomes of policy Distribution - of “economic wellbeing” Micro-economic policy – industry and jobs Regional economic development Local planning – – urban development, social services, recreation, infrastructure, transport, etc.. What data is needed? • • • • • Population, Participation, Productivity Population growth and turnover Labour market statistics Industry statistics Household economic wellbeing – wealth, income • Aggregate production – GRP, GVA Some economic drivers • Productive environment (innovation, institutions, technology, knowledge infrastructure, national & global context) • Human resources (demography, migration, social capital) • Land (infrastructure, environment, quality of place) Overview • • • • • About regional statistics at ABS Why regional economic data is needed Which regions ? What do we know (and not know) ? Future directions Which regions? • Administrative regions (State, LGA, RDA) • Environmental regions (catchments, land management) • Service regions (health, tourism, transport) • ABS statistical geography (Australian Statistical Geography Standard - ASGS) Local level economic data relates to …. People who work here Businesses that operate here People that live here Statistical geography – SA4 Overview • • • • • About regional statistics at ABS Why regional economic data is needed Which regions ? What do we know (and not know) ? Future directions Information in State Accounts (5206.0) Includes more than aggregate growth • Consumer behaviour • Capital projects – GFCF • Government operation • Industry operation and distribution • Income and wealth distribution Sub-state economic data What we know • • • • Some labour market characteristics Counts of businesses Personal income / Household income Commuter patterns from Census data We know less about… • • • • Value of production (apart from Agriculture) Business performance Regional prices Personal or household wealth Leichhardt LGA, NSW Population in Leichhardt • Estimated Resident Population in 2010 was 55,596 • Average Annual Growth Rate from 20052010 was 0.26% • Population turnover between 2001 and 2006 was 75.2% • 16 335 arrivals, 14 563 departures Pensions & allowances – Leichhardt (2004 – 2008) Leichhardt Economic Portrait report; using Census 2006 data Other census data used.. • • • • • Journey to work Occupation Highest qualifications Hours of work Birthplace of workers Leichhardt Counts of Businesses Local level economic data for Leichhardt 38,500 people work here 7,300 businesses operate here 55,500 people live here Overview • • • • • About regional statistics at ABS Why regional economic data is needed Which regions ? What do we know (and not know) ? Future directions Regional data development • Use administrative data sets – Tax, Centrelink, Valuer generals • Small area modelling – Household wealth, regional economic models • Data collection – Census content development, local surveys ABS future directions • Harness administrative data opportunities • Support regional data providers and local data collections • Prioritise regional economic data needs – Develop business cases for regional data development work • Collaborate on regional case studies of national significance Talk to us ! $ data Needs Thankyou regional.statistics@abs.gov.au lisa.conolly@abs.gov.au
