final: healthy spring water company defining the price
advertisement
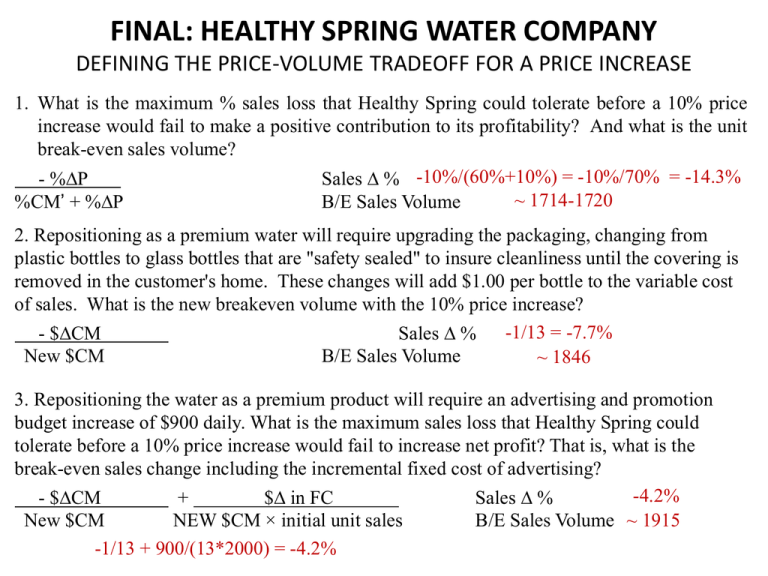
FINAL: HEALTHY SPRING WATER COMPANY DEFINING THE PRICE-VOLUME TRADEOFF FOR A PRICE INCREASE 1. What is the maximum % sales loss that Healthy Spring could tolerate before a 10% price increase would fail to make a positive contribution to its profitability? And what is the unit break-even sales volume? - %DP Sales D % -10%/(60%+10%) = -10%/70% = -14.3% ~ 1714-1720 %CM’ + %DP B/E Sales Volume 2. Repositioning as a premium water will require upgrading the packaging, changing from plastic bottles to glass bottles that are "safety sealed" to insure cleanliness until the covering is removed in the customer's home. These changes will add $1.00 per bottle to the variable cost of sales. What is the new breakeven volume with the 10% price increase? - $DCM Sales D % -1/13 = -7.7% New $CM B/E Sales Volume ~ 1846 3. Repositioning the water as a premium product will require an advertising and promotion budget increase of $900 daily. What is the maximum sales loss that Healthy Spring could tolerate before a 10% price increase would fail to increase net profit? That is, what is the break-even sales change including the incremental fixed cost of advertising? -4.2% - $DCM + $D in FC Sales D % New $CM NEW $CM × initial unit sales B/E Sales Volume ~ 1915 -1/13 + 900/(13*2000) = -4.2% Profit Implications of Competitive (Re)Actions Healthy’s Profit if Competitor Matches Price Change (Use Primary Elasticity ≈ -1) New Expected Expected Exp Var Costs Total Expected Price D Price Demand Revenue ($9 VC/U) Fixed Costs Profit $45,540 $18,630 $20,900 $6,010 10% $22.00 2,070 $46,000 $20,700 $20,900 $4,400 0% $20.00 2,300 Healthy’s Profit if Competitor Does Not Match Price Change (Increase Elasticity ≈ -2) New Expected Expected Exp Var Costs Total Expected Price D Price Demand Revenue ($9 VC/U) Fixed Costs Profit 1,840 $40,480 $16,560 $20,900 $3,020 10% $22.00 2,300 $46,000 $20,700 $20,900 $4,400 0% $20.00 Cheapie’s Profit if Cheapie maintains/increases price (Healthy’s Increase Elasticity ≈ -2) Healthy Cheapie’s Expected Expected Exp Var Costs Total Expected Price D Price Demand Revenue ($8 VC/U) Fixed Costs Profit 10% $20.00 2,660 $53,200 $21,280 $24,000 $7,920 0% $20.00 2,200 $44,000 $17,600 $24,000 $2,400 10% $22.00 1,980 $43,560 $15,840 $24,000 $3,720 Cheapie’s Profit if Cheapie decreases price (Healthy’s Increase Elasticity ≈ -2; Cheapie’s Decrease Elasticity ≈ -3) Healthy Cheapie’s Expected Expected Exp Var Costs Total Expected Price D Price Demand Revenue ($8 VC/U) Fixed Costs Profit 3,232 $58,176 $25,856 $25,000 $7,320 10% $18.00 2,860 $51,480 $22,880 $24,000 $4,600 0% $18.00 6. Construct a payoff matrix that summarizes unit volumes and profit for Cheapie with prices at $18 and $20 and for Healthy with prices at $20 and $22. What are the take-aways? Exhibit 1: Payoff Matrix under Different Pricing Scenarios1 Healthy Cheapie Total Healthy Cheapie Total 3232 4720 1840 2660 4500 $7,320 $5,764 $3,020 $7,920 $10,940 1860 2860 4720 2300 2200 4500 ($440) $4,600 $4,160 $4,400 $2,400 $6,800 Units 1488 $22.00 Profit ($1,556) Healthy price Units $20.00 Profit $18.00 $20.00 Cheapie price Strictly according to the payoff matrix… 1. If Healthy sets its price at $20, Cheapie maximizes profit with a: $ price 2. If Healthy sets its price at $22, Cheapie maximizes profit with a: $ price 3. Given that Cheapie will try to maximize profit, what price should Healthy set? $ price 4. What is the major concern facing Healthy if it keeps its price at $20.00?
