Price elasticity of demand for beer, wine and spirits
advertisement
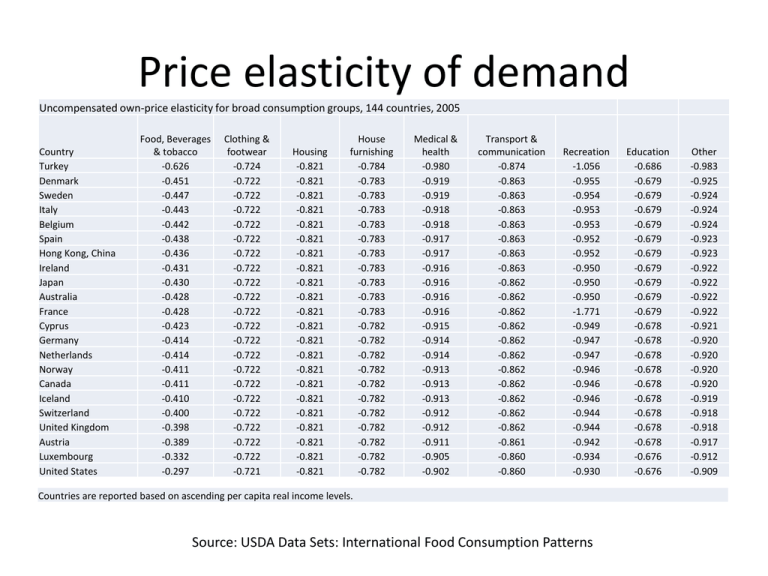
Price elasticity of demand Uncompensated own-price elasticity for broad consumption groups, 144 countries, 2005 Country Turkey Denmark Sweden Italy Belgium Spain Hong Kong, China Ireland Japan Australia France Cyprus Germany Netherlands Norway Canada Iceland Switzerland United Kingdom Austria Luxembourg United States Food, Beverages & tobacco -0.626 -0.451 -0.447 -0.443 -0.442 -0.438 -0.436 -0.431 -0.430 -0.428 -0.428 -0.423 -0.414 -0.414 -0.411 -0.411 -0.410 -0.400 -0.398 -0.389 -0.332 -0.297 Clothing & footwear -0.724 -0.722 -0.722 -0.722 -0.722 -0.722 -0.722 -0.722 -0.722 -0.722 -0.722 -0.722 -0.722 -0.722 -0.722 -0.722 -0.722 -0.722 -0.722 -0.722 -0.722 -0.721 Housing -0.821 -0.821 -0.821 -0.821 -0.821 -0.821 -0.821 -0.821 -0.821 -0.821 -0.821 -0.821 -0.821 -0.821 -0.821 -0.821 -0.821 -0.821 -0.821 -0.821 -0.821 -0.821 House furnishing -0.784 -0.783 -0.783 -0.783 -0.783 -0.783 -0.783 -0.783 -0.783 -0.783 -0.783 -0.782 -0.782 -0.782 -0.782 -0.782 -0.782 -0.782 -0.782 -0.782 -0.782 -0.782 Medical & health -0.980 -0.919 -0.919 -0.918 -0.918 -0.917 -0.917 -0.916 -0.916 -0.916 -0.916 -0.915 -0.914 -0.914 -0.913 -0.913 -0.913 -0.912 -0.912 -0.911 -0.905 -0.902 Transport & communication -0.874 -0.863 -0.863 -0.863 -0.863 -0.863 -0.863 -0.863 -0.862 -0.862 -0.862 -0.862 -0.862 -0.862 -0.862 -0.862 -0.862 -0.862 -0.862 -0.861 -0.860 -0.860 Recreation -1.056 -0.955 -0.954 -0.953 -0.953 -0.952 -0.952 -0.950 -0.950 -0.950 -1.771 -0.949 -0.947 -0.947 -0.946 -0.946 -0.946 -0.944 -0.944 -0.942 -0.934 -0.930 Countries are reported based on ascending per capita real income levels. Source: USDA Data Sets: International Food Consumption Patterns Education -0.686 -0.679 -0.679 -0.679 -0.679 -0.679 -0.679 -0.679 -0.679 -0.679 -0.679 -0.678 -0.678 -0.678 -0.678 -0.678 -0.678 -0.678 -0.678 -0.678 -0.676 -0.676 Other -0.983 -0.925 -0.924 -0.924 -0.924 -0.923 -0.923 -0.922 -0.922 -0.922 -0.922 -0.921 -0.920 -0.920 -0.920 -0.920 -0.919 -0.918 -0.918 -0.917 -0.912 -0.909 Price elasticity of demand for beer, wine and spirits Source: Fogarty, 2008. The demand for beer, wine and spirits: Insights form a meta-analysis approach. American Wine Association Cross-price elasticities of demand for low, middle and high-income countries Source: USDA, 2010. Cross-price elasticities of demand for 114 countries Income elasticities of demand for food Source: Regmi et al. , 2001. Cross-country analysis of food consumption patterns. USDA Economic Research Service Elasticity of supply for housing Source: Sanchez and Johansson, 2011. The price responsiveness of housing supply in OECD countries. OECD Elasticity of supply for oil Krichene, 2002. World crude oil and natural gas: a demand and supply model. Energy Economics, 24, 557-576


