Seismic source & instrument response deconvolution (receiver
advertisement
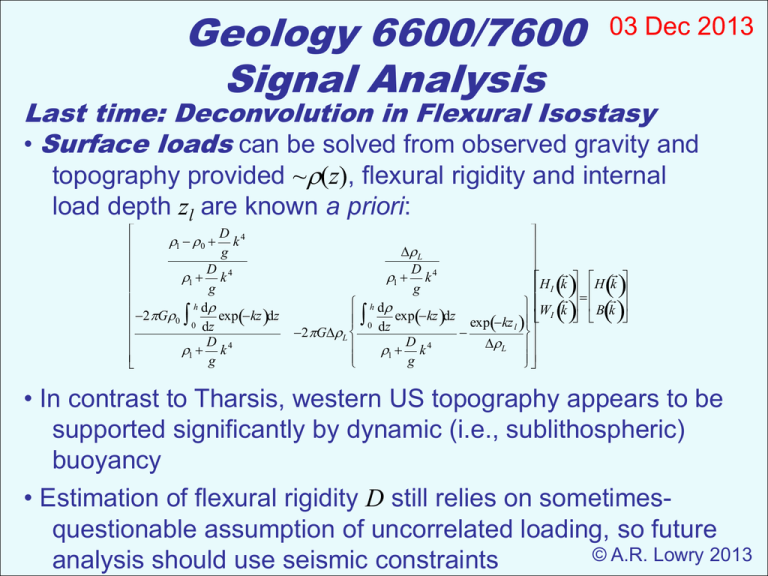
Geology 6600/7600 Signal Analysis 03 Dec 2013 Last time: Deconvolution in Flexural Isostasy • Surface loads can be solved from observed gravity and topography provided ~(z), flexural rigidity and internal load depth zl are known a priori: D 1 0 k 4 g D 1 k 4 g h d 2 G0 expkz dz 0 dz D 1 k 4 g 2 GL L D 4 1 k H I k H k g W k B k h d expkz dz exp kz I 0 dz l D 4 L 1 k g • In contrast to Tharsis, western US topography appears to be supported significantly by dynamic (i.e., sublithospheric) buoyancy • Estimation of flexural rigidity D still relies on sometimesquestionable assumption of uncorrelated loading, so future © A.R. Lowry 2013 analysis should use seismic constraints Deconvolution of source & receiver terms from distant earthquakes: P S Rayleigh Nov 30 Little Cottonwood Creek seismogram for M5 earthquake in S Mexico… Recall that a seismogram represents a convolution of the source-time function s(t) with the Earth system response h(t) and the seismometer response i(t): rt st hti t R SH I For imaging applications we would like to remove the source and receiver terms and just look at the Earth response. One approach to doing this is to isolate the impulse response to phase-conversions at impedance boundaries using teleseismic receiver functions In the most commonly-used approaches to seismic receiver function analysis (e.g., Ammon, BSSA 1991; Ligorria & Ammon, BSSA 1999) the horizontal (E, N) components of a three-component seismogram are rotated into radial and transverse directions based on back-azimuth to Vertical the source event: Radial N Transverse P E S Radial For a teleseismic event arriving rays are near-vertical, so the vertical component contains predominantly P-wave particle motion (with a small contribution from SV) and the radial horizontal component contains predominantly SH motion (with a small contribution from P). In an idealized (1D, isotropic) Earth, the transverse contains motion neither from primary P or converted (polarized) S! Both vertical & radial components are convolved with the same source-time function and instrument response for each different phase that comes in: rZ t N k 0 st hkZ t i t rR t N st hkR t i t k 0 Here, k represents each of N phases that originated as a P wave and, after conversion, arrived as an S wave: (Ammon, BSSA 1991) Thus the source and instrument response are removed from the time series by (frequency domain) division of the radial by vertical components. The resulting impulse response function is called the receiver function: n H k 0 n k 0 n RkR SI RkZ SI k 0 n k 0 (Ammon, BSSA 1991) RkR RkZ Receiver Function Estimates of Crustal Thickness: Delay Time P Ps Crust Mantle P Ps • Deconvolve source-time function to get impulse response of phases converted at impedance boundaries • Delay time between phase arrivals depends on crustal thickness and relative velocities of P & S phases • EARS uses iterative time-domain deconvolution [Ligorria & Ammon, BSSA, 1999]: well-suited to automation Contribution of crustal thickness (H) versus vP/vS ratio (K) to delay time is ambiguous… P Ps PpPs PpSs PsPs PpSs PsPs P Ps PpPs Resolve using reverberations, which have differing sensitivity to H and K H–K Stacking: [Zhu & Kanamori, JGR, 2000] Ps PpSs & PsPs PpPs PpSs PsPs P Ps PpPs Crustal thickness (H) & vP/vS ratio (K) parameters that predict the observed phase delay times intersect at a point in parameter space H–K Stacking: [Zhu & Kanamori, JGR, 2000] (EARS H–K stack for station COR) Method stacks [Crotwell & Owens, 2005] Ps PpSs & PsPs PpPs PpSs PsPs P Ps PpPs observed amplitudes at delay times predicted for converted Ps phase and reverberations. Max stack amplitude ideally reveals crustal thickness & vP/vS ratio. The Problem: (EARS H–K stack for station TA.P10A) The Moho is not the only lithospheric impedance contrast… And crustal thickness is not constant Root Variogram H (km) Root Variogram K Crustal Thickness (H) vP/vS Ratio (K) Despite outliers and other issues, crustal thickness & vP/vS have statistical properties consistent with a fractal surface… Station TA.O09A (Central Nevada) Variograms can be used to estimate a “most likely” crustal thickness and vP/vS ratio via optimal interpolation from nearby sites. Station TA.O09A (Central Nevada) Can also model gravity predicted for each H & K at the site… And search for a “most likely” model with uncertainties. Station TA.O09A (Central Nevada) Combined Optimal Interp. Likelihood Filter Station TA.O09A (Central Nevada) Unlikely stack amplitude maxima are downweighted using likelihood statistics
