Document
advertisement
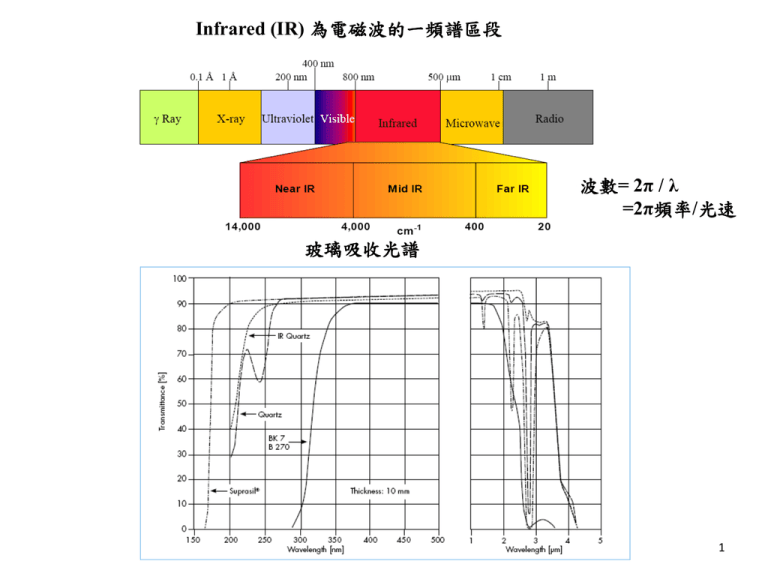
Infrared (IR) 為電磁波的一頻譜區段 波數= 2π / λ =2π頻率/光速 玻璃吸收光譜 1 Excited electronic state Energy Dissociation energy Ground state Rotational transition (in microwave) Internuclear separation 2 Symmetrical molecule: No dipole, No absorption Heteronuclear molecule: dμ/dx ≠0 absorbs energy at ν = E2 / h 紅外光會與特定的分子鍵結能量 作用,產生紅外光吸收, 只對不平衡(對稱)的鍵結發生作用。下 列物質(氣體)不與紅外光發生作用(不吸收紅外 光): 鈍氣(單原子分子):He,Ne,Ar,Kr,Xe…. – 金屬氣體、液體 – 同核共價雙原子分子(homonuclear Diatomics): H2 ,N2 ,O2 ,F2 ,Cl2 ….非極性分子 3 – 少數氣體之紅外光吸收係數太低︰H2S (正反射)表面光滑面 Diffuse Reflection (散射反射) --表面粗糙面 Specular Absorption Reflection (正吸收反射) Grazing Angle Reflectance -- 可量測約幾十個 埃 A Total Reflectance (ATR 全反射) --表面 0.2 - 6 um 4 KBr 鹽片法 (用於穿透法) 可使用之基質包括 : KBr, KCl, NaCl, KI, CsI 及 PE powder 配件內容: a) 瑪瑙研砵及杵(自動磨碎機) b) 光譜級KBr粉末 c) 紙墊片 d) 13mm鑄模(die) e) 15ton油壓打碇機 f) 13mm 鹽片固定器 5 FTIR . 5 8 0 0 Y 5 . 0 3 5 5 4 1 3 2 0 2 3 1 4 0 0 0 0 0 . 0 0 0 0 0 . 0 ~ M Y 3 0 2 1 4 1 0 0 0 5 0 0 0 0 0 0 0 0 c m - Laser IR source 6 Background 背景掃瞄 穿透光譜 80.8 60 Ratio %T 40 Sample 樣品掃瞄 20 0.3 4400.0 4400.0 2000 1000 2000 cm-1 1000 450.0 450.0 cm-1 7 IR spectra of RO-ZnO-B2O3 (RO= MgO,CaO, SrO and BaO) glasses BO4 MZB BO3 CZB SZB BZA H2O, OH bending vibration of borate segments No peak at 806cm-1 , no boroxol ring BO3 asymmetric stretching vibrations of B-O and B-O¯ bond. These bands have become broad in present glasses in the order MgO < CaO < SrO < BaO. 1200-1400 cm-1 is =B-O-B≡ linkage. 8 IR spectra of RO-PbO-B2O3 (RO= MgO,CaO, SrO and BaO) glasses BO4 groups the peaks around 1374-1407cm-1 which are overlapping on vibration of BO3 units might reveal the existence of PbO3 and PbO4 pyramids. 9 IR spectra of CaO-Al2O3-SiO2 glasses Al2O3/CaO=0.5 CaO=20mol% SiO2=60mol% 10 1. Vibration of O in Al-O-Si or Si-O-Si :475cm-1. The shift of the band to lower frequencies with the addition of alumina can be explained by an increase in the number of Si-O-A1 bonds, which have a smaller force constant. 2. AlO4 tetrahedra : 710cm-1. 3. Si-O bending and A1-O stretching, with the aluminum ions in four-fold coordination:750~800cm-1. 4. The bands observed in the 850 to 1300 cm-I region are due to the effect of calcium ions and aluminum ions on the Si-O bonds. The band of shifts from higher frequencies to about 880 cm-1 as the alumina content was increased. This shift was attributed to the presence of Si(OA1)3 and Si(OA1)4, i.e., silicon-oxygen tetrahedra with three and with four corners shared with aluminum-oxygen polyhedra, respectively. The sub-region of 1050~ 1100 cm-1 represents the vibration of the Si(OA1/Ca) group, i.e., the stretching vibration of the silicon-oxygen bond of the [SiO4] tetrahedra with one corner shared with an aluminum or calcium polyhedron. The shoulder observed on the 1100 cm-1 band, in the spectra of glasses with a silica content higher than 60 mol%, is probably a vibration of SiO4 with four bridging oxygens. The low energy part is likely due to Si(OA1/Ca) 3 and Si(OA1/Ca)4. This latter band was said to be due to [SiO4] tetrahedra with three or four non-bridging oxygens. 5. The aluminum ions were four-fold coordinated in CaO-Al2O3-SiO2 glasses. No six-coordinated aluminum present in CaO-Al2O3-SiO2 glasses. This is different from the structure of Na2O-Al2O3-SiO2 glasses. [AlO6] polyhedron presents in Na2O-Al2O3-SiO2 glasses as Al2O3/Na2O > 1. In CaO-Al2O3-SiO2 glasses, the excess aluminum not included in the tetrahedral aluminosilicate network forms neutral species, ‘triclusters‘, i.e. three-coordinated oxygen. 11 (反射光譜) 12 13 14 15 16 17 18 19 20 21 22 23 24 25 Raman散射原理 l l0 Incident light l0 Absorbed Transmitted l0 l0 Reflected l l0 Inelastic Raman scattering l0 Elastic Scattered Rayleigh scattering 26 mind=aE a: poalrizability ANTI-STOKES STOKES Rayleigh 0 - 0 0 + 27 Raman 光譜的實驗裝置 透鏡 L1 聚焦雷射光束,使其最集中的區域可達 直徑10μm,試樣上的照 度大約 可增大一千倍。如功率密度太高會損壞樣品時,則不 用此透鏡。 透鏡 L2 是聚集樣品的散射光,並準確地入射至分光儀 的狹縫上,以最佳 的立體角收集散射光,並使之與分 光儀的集光立體角相匹配。 M1 把透過樣品的雷射光束反射而來回多次通過樣 品,以增強雷射對樣 品的激發效率。對於透明樣 品照射光的強度可增大五倍以上。 M2 則把反方向的散射光收集起來反射回去,可將 進入分光儀的散射光 的立體角增加一倍。 28 Raman散射光譜分析 圖為四氯化碳(CCl4) 的Raman光譜圖 29 Raman spectra of alkali silica glasses (J. of Non-Crysta. Solids 58 (1983) 323-352) Raman spectrum (I∥and I ⊥) of silica glass The 440 cm-1 band results from symmetric motion of the bridging oxygen relative to the silicon atoms in the three-dimensional network structure (s(Si-O-Si)). Although the 440 cm-1 band has been assigned to a transverse optic (TO) mode and the 492 cm-1 band to a longitudinal optic (LO) mode, the s (Si-O-Si) mode is infrared inactive. The weak band at 606 cm-1 is attributed to defect structures in the silica network. The broad envelope located near 800 cm-1 is associated with the network structure of the SiO2 glass, as its intensity drops with depolymerization of the glass. Oxygen isotopic substitution data for SiO2 glass indicate that the 800 cm-1 feature results primarily from silicon motion. Two broad, weak, and depolarized bands at 1060 cm -1 and 1190 cm-1 are probably due to the antisymmetric Si-O-Si stretching mode (as(Si-O-Si)) in which the bridging oxygen atom moves parallel to the Si-Si 30 axis. Raman spectra of alkali silicate glasses 440 cm-1 (s(Si-O-Si)) TO mode, 492 cm-1 LO mode, 606 cm-1 defect structures in the silica network. 800 cm-1 network structure of the SiO2 glass, as its intensity drops with depolymerization of the glass. Oxygen isotopic substitution data for SiO2 glass indicate that the 800 cm-1 feature results primarily from silicon motion. 1060 cm -1 and 1190 cm-1 are TO and LO mode of as(Si-O-Si). 31 Raman spectra of xLi2O-(1-x)B2O3 glasses (J. Phys. Chem. Solids, 54 (1993) 621) X=0.5 X=0.4 X=0.35 X=0.3 X=0.25 X=0.2 X=0.15 500cm-1 pentaborate, tetraborate and diborate groups. 550 cm-1 isolated diborate groups. 660cm-1 pentaborate groups. 806cm-1 Boroxol ring. 770cm-1 BO4 unit. 950 cm-1 pentaborate and tetraborate groups. The shift of the 950cm-1 to a lower value (925cm-1) is attributed to the linking of pentaborate and tetraborate groups to the orthoborate type of structure. 840 and 1210 cm-1 symmetric stretching of the B-O-B bridges and to the stretching of the terminal B-O- bonds, respectively, in B2O5anions. (pyroborate) 1300~1500cm-1 stretching of B-O- bonds. X=0.1 32 The schematic representation of different borate arrangements. (a) Boroxol unit; B2O3 (b) pentaborate unit;Li2O-5B2O3 (c) triborate unit; Li2O-3B2O3 (d) orthoborate unit; 3Li2O-B2O3 (e) metaborate unit; Li2O-B2O3 (f) pyroborate unit; 2Li2O-B2O3 (g) diborate unit; Li2O-2B2O3 (h) loose BO4. Solid circlea represent boron atoms and open circles oxygen atom. An open circle with a negative sign indicates a nonbridging oxygen. 33 Low frequency Raman spectra in xLi2O-(1-x)B2O3 glasses The low frequency part of the Raman spectra of glasses is dominated by the so-called “boson” peak. It represents the extent of short-range ordering where a phonon can propagate with no damping. the SCR can be estimated simply from the relation 2s = vtpc /w where vt is the transverse acoustic waves, w is the peak position of the boson peak. The short-range ordering in lithium borate glasses as shown in figure below does not exceed the dimension of one six-membered ring (8 ). The formation of BO4 units which results from the addition of Li2O to B2O3 frustrates the preferential ordering of the BO3 triangles and therefore reduces the SCR to 4.2 (at x = 0.50) in the lithium borate glasses. 135 cm-1 band in lithium borate glasses may be attributed to the torsion modes of BO3 and BO4 units. 34

