ysp2014_poster
advertisement
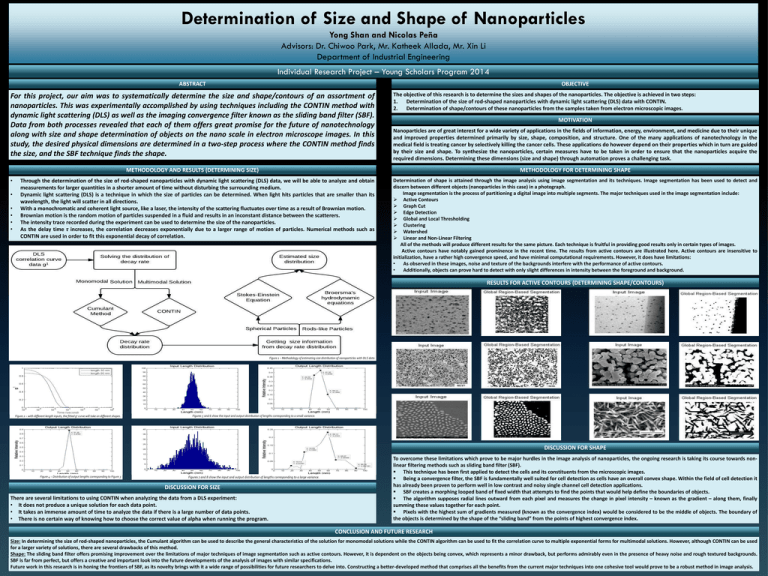
Determination of Size and Shape of Nanoparticles Yong Shan and Nicolas Peña Advisors: Dr. Chiwoo Park, Mr. Katheek Allada, Mr. Xin Li Department of Industrial Engineering Individual Research Project – Young Scholars Program 2014 ABSTRACT OBJECTIVE For this project, our aim was to systematically determine the size and shape/contours of an assortment of nanoparticles. This was experimentally accomplished by using techniques including the CONTIN method with dynamic light scattering (DLS) as well as the imaging convergence filter known as the sliding band filter (SBF). Data from both processes revealed that each of them offers great promise for the future of nanotechnology along with size and shape determination of objects on the nano scale in electron microscope images. In this study, the desired physical dimensions are determined in a two-step process where the CONTIN method finds the size, and the SBF technique finds the shape. The objective of this research is to determine the sizes and shapes of the nanoparticles. The objective is achieved in two steps: 1. Determination of the size of rod-shaped nanoparticles with dynamic light scattering (DLS) data with CONTIN. 2. Determination of shape/contours of these nanoparticles from the samples taken from electron microscopic images. MOTIVATION Nanoparticles are of great interest for a wide variety of applications in the fields of information, energy, environment, and medicine due to their unique and improved properties determined primarily by size, shape, composition, and structure. One of the many applications of nanotechnology in the medical field is treating cancer by selectively killing the cancer cells. These applications do however depend on their properties which in turn are guided by their size and shape. To synthesize the nanoparticles, certain measures have to be taken in order to ensure that the nanoparticles acquire the required dimensions. Determining these dimensions (size and shape) through automation proves a challenging task. METHODOLOGY AND RESULTS (DETERMINING SIZE) • • • • • • METHODOLOGY FOR DETERMINING SHAPE Through the determination of the size of rod-shaped nanoparticles with dynamic light scattering (DLS) data, we will be able to analyze and obtain measurements for larger quantities in a shorter amount of time without disturbing the surrounding medium. Dynamic light scattering (DLS) is a technique in which the size of particles can be determined. When light hits particles that are smaller than its wavelength, the light will scatter in all directions. With a monochromatic and coherent light source, like a laser, the intensity of the scattering fluctuates over time as a result of Brownian motion. Brownian motion is the random motion of particles suspended in a fluid and results in an inconstant distance between the scatterers. The intensity trace recorded during the experiment can be used to determine the size of the nanoparticles. As the delay time τ increases, the correlation decreases exponentially due to a larger range of motion of particles. Numerical methods such as CONTIN are used in order to fit this exponential decay of correlation. Determination of shape is attained through the image analysis using image segmentation and its techniques. Image segmentation has been used to detect and discern between different objects (nanoparticles in this case) in a photograph. Image segmentation is the process of partitioning a digital image into multiple segments. The major techniques used in the image segmentation include: Active Contours Graph Cut Edge Detection Global and Local Thresholding Clustering Watershed Linear and Non-Linear Filtering All of the methods will produce different results for the same picture. Each technique is fruitful in providing good results only in certain types of images. Active contours have notably gained prominence in the recent time. The results from active contours are illustrated here. Active contours are insensitive to initialization, have a rather high convergence speed, and have minimal computational requirements. However, it does have limitations: • As observed in these images, noise and texture of the backgrounds interfere with the performance of active contours. • Additionally, objects can prove hard to detect with only slight differences in intensity between the foreground and background. RESULTS FOR ACTIVE CONTOURS (DETERMINING SHAPE/CONTOURS) Figure 1 – Methodology of estimating size distribution of nanoparticles with DLS data Figure 2 – with different length inputs, the fitted g1 curve will take on different shapes. Figures 5 and 6 show the input and output distribution of lengths corresponding to a small variance. DISCUSSION FOR SHAPE Figure 4 – Distribution of output lengths corresponding to Figure 3 Figures 7 and 8 show the input and output distribution of lengths corresponding to a large variance. DISCUSSION FOR SIZE There are several limitations to using CONTIN when analyzing the data from a DLS experiment: • It does not produce a unique solution for each data point. • It takes an immense amount of time to analyze the data if there is a large number of data points. • There is no certain way of knowing how to choose the correct value of alpha when running the program. To overcome these limitations which prove to be major hurdles in the image analysis of nanoparticles, the ongoing research is taking its course towards nonlinear filtering methods such as sliding band filter (SBF). This technique has been first applied to detect the cells and its constituents from the microscopic images. Being a convergence filter, the SBF is fundamentally well suited for cell detection as cells have an overall convex shape. Within the field of cell detection it has already been proven to perform well in low contrast and noisy single channel cell detection applications. SBF creates a morphing looped band of fixed width that attempts to find the points that would help define the boundaries of objects. The algorithm supposes radial lines outward from each pixel and measures the change in pixel intensity – known as the gradient – along them, finally summing these values together for each point. Pixels with the highest sum of gradients measured (known as the convergence index) would be considered to be the middle of objects. The boundary of the objects is determined by the shape of the “sliding band” from the points of highest convergence index. CONCLUSION AND FUTURE RESEARCH Size: In determining the size of rod-shaped nanoparticles, the Cumulant algorithm can be used to describe the general characteristics of the solution for monomodal solutions while the CONTIN algorithm can be used to fit the correlation curve to multiple exponential forms for multimodal solutions. However, although CONTIN can be used for a larger variety of solutions, there are several drawbacks of this method. Shape: The sliding band filter offers promising improvement over the limitations of major techniques of image segmentation such as active contours. However, it is dependent on the objects being convex, which represents a minor drawback, but performs admirably even in the presence of heavy noise and rough textured backgrounds. SBF is far from perfect, but offers a creative and important look into the future developments of the analysis of images with similar specifications. Future work in this research is in honing the frontiers of SBF, as its novelty brings with it a wide range of possibilities for future researchers to delve into. Constructing a better-developed method that comprises all the benefits from the current major techniques into one cohesive tool would prove to be a robust method in image analysis.
