CBB-Poster - The Zhang Lab — Computational Biology and
advertisement
A novel method for measuring codon usage
bias and estimating its statistical significance
Zhang Zhang
CAS Key Laboratory of Genome Sciences and Information, Beijing Institute of Genomics, Chinese Academy of Sciences
Introduction
ˆ) codon
Therefore, when both expected () and observed (
usage vectors are available for any given sequence, CDC
renders a distance coefficient ranging from 0 (no bias) to 1
(maximum bias), to represent CUB, expressed by the deviation
ˆ from .
of
Codon usage bias or CUB, a phenomenon in which
synonymous codons are used at different frequencies, is
generally believed to be a combined outcome of mutation
pressure, natural selection, and genetic drift.
Why should we care
ˆ xyz
xyz
CDC 1
Genes often exhibit variable CUBs, which are closely related
with gene expression for translational efficiency and/or accuracy.
The ability to accurately quantify CUBs for protein-coding
sequences is of fundamental importance in revealing the
underlying mechanisms behind codon usage and
understanding gene evolution and function in general.
xyz
2
xyz
xyz
2
ˆ
xyz
xyz
Statistical significance of codon usage bias
To evaluate the statistical significance of codon usage bias, we
implement a bootstrap resampling of N=10000 replicates for
any given sequence.
Each replicate is randomly generated according to the
sequence background nucleotide composition (Si and Ri, i = 1,
2, 3) and the sequence length.
When CUB is derived from each replicate, a bootstrap
distribution of N estimates of CUB is obtained.
A two-sided bootstrap P-value is calculated as twice the
smaller of the two one-sided P-values. P ranges from 0 to 1.
What is the question
Extant measures for estimating CUB have limitations.
• They are not supplied with straightforward procedures for
assessing the statistical significance of the bias in codon
usages for any given gene.
• They are not fully effective at incorporating background
nucleotide composition into CUB estimation.
How we can do it
By convention, a statistically significant CUB is identified by P <
0.05. CDC features its first application of the bootstrap
resampling in estimating the statistical significance of CUB.
Here we present a novel measure, Codon Deviation Coefficient
(CDC), using it to characterize CUB and to ascertain its
statistical significance.
Implementation and availability
CDC is written in standard C++ programming language and
implemented into Composition Analysis Toolkit (CAT). Its
software package, including compiled executables on
Linux/Mac/Windows, example data, documentation, and source
codes, is freely available at http://cbb.big.ac.cn/software.
Materials and methods
Expected codon usage
CDC considers both GC and purine contents as background
nucleotide composition and derives expected codon usage from
observed positional GC and purine contents. We denote the
content of the four nucleotides (adenine, thymine, guanine, and
cytosine), GC content, and purine content as A, T, G, C, S and
R, respectively. The expected position-dependent nucleotide
contents are formulated:
Results and discussion
Comparative analysis on simulated data
To evaluate the performance of CDC and compare it against Nc
(Effective Number of Codons) and the most powerful extant
measure, Nc′ (Nc’s variant), We simulated sequences by
specifying different heterogeneities in positional background
nucleotide compositions (Figure 1) and varying sequence
lengths (Figure 2).
where Si and Ri are their corresponding observed contents at
codon position i and Ai, Ti, Gi, Ci are expected nucleotide
contents at codon position i (i = 1, 2, 3).
For any sense codon xyz, the expected usage πxyz is defined as
the product of its constituent expected nucleotide contents
x1y2z3, normalized by the sum over all sense codons, viz.,
xyz
x1y 2z 3
w
abc
It should be noted that CDC ranges from 0 (no bias) to 1
(maximum bias), whereas Nc′ and Nc range from 20 (maximum
bias) to 61 (no bias). To facilitate comparisons of CDC with Nc′
and Nc, we use the formula (61- Nc′) / 41 and (61- Nc) / 41 to
rescale their ranges, denoted as scaled Nc′ and scaled Nc,
respectively, from 0 (no bias) to 1 (maximum bias).
,
a 1b 2 c 3
abc
where w abc
1, if abc is a sense codon
0, otherwise
and
x , y , z, a, b, c { A, T , G , C } .
Codon usage bias
1.
2.
3.
4.
Bulmer, M. 1991. The selection-mutation-drift theory of synonymous codon usage.
Genetics 129:897-907.
Hershberg, R, DA Petrov. 2008. Selection on codon bias. Annu Rev Genet 42:287-299.
Novembre, JA. 2002. Accounting for background nucleotide composition when measuring
codon usage bias. Mol Biol Evol 19:1390-1394.
Plotkin, JB, G Kudla. 2011. Synonymous but not the same: the causes and consequences
of codon bias. Nature Reviews Genetics 12:32-42.
Application to empirical data
To empirically test CDC and compare it to three popular
measures, Nc′, Nc and CAI, we collected multiple expression
data sets from different species and correlated their CUBs with
gene expression levels. Overall, CDC correlates positively with
gene expression level, much better than scaled Nc', scaled Nc,
and CAI (Table 1).
Table 1 Correlation coefficients of CUB with gene expression level
D.
E. coli1
S.
C.
A.
Measure
melanogaster
2
4 thaliana5
elegans
LB M9 cerevisiae
3
0.433 0.367
0.654
0.460
0.374
0.228
Scaled Nc′ 0.315 0.187
0.664
0.302
0.328
0.130
Scaled Nc 0.257 0.125
CAI
0.443 0.288
0.600
0.675
0.321
0.386
0.192
-0.118
0.063
0.034
Note: Expression data were obtained from 1Bernstein et al, 2Holstege et al,
3Zhang et al, 4Roy et al, and 5Wuest et al. P < 0.0001 for all values.
We proceeded to calculate CDC values for all E. coli genes.
The gene with the highest CDC value and statistical
significance in CUB is rpmI (CDC=0.481, P<0.05), which
encodes ribosomal protein L35.
CDC values for 54 ribosomal protein (RP) genes in E. coli,
are larger than the mean and median values of all genes.
Nearly all RP genes have statistically significant CUBs, with
three exceptions (Table 2).
Table 2 Three exceptions of RP genes having insignificant CUBs
RP Gene CDC
P
Description
encoding RP L31, which is loosely
rpmE
0.267 0.1136
associated with ribosome
encoding RP L32, which locates
rmpF
0.329 0.1096
near the peptidyltransferase center
encoding RP L36, which is nonrpmJ
0.422 0.0564
essential for protein synthesis
These results suggest that CDC has the potential to illuminate
the evolutionary process that has operated on each gene.
Any coding sequence can be represented as a vector of n
dimensions, whose entries correspond to n sense codon
usages in the sequence.
The dimension n equals 61 for the canonical code; although
codons ATG and TGG could be set aside due to the absence of
synonymous codons, calculation based on a vector of 61
dimensions instead of 59 dimensions makes little substantial
difference.
To calculate CUB for any given sequence, we employ the
cosine distance metric based on the cosine of the angle
between the two vectors of n dimensions.
Literature cited
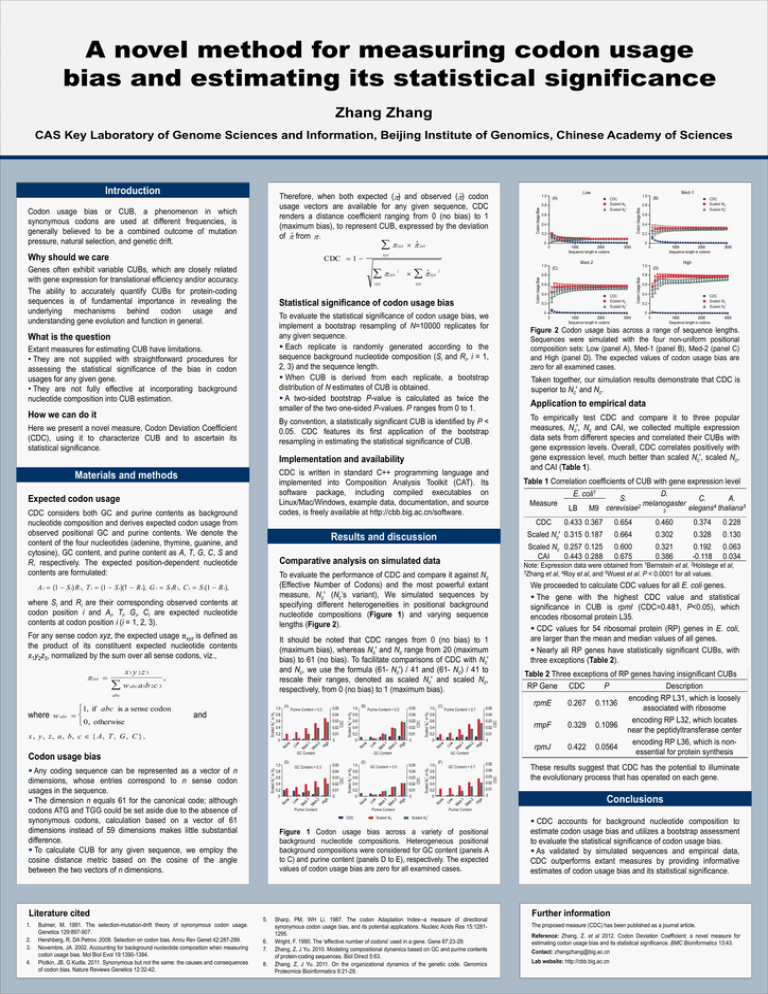
Taken together, our simulation results demonstrate that CDC is
superior to Nc′ and Nc.
CDC
A i (1 S i) R i , T i (1 S i )(1 R i ), G i S iR i, C i S i(1 R i ),
Figure 2 Codon usage bias across a range of sequence lengths.
Sequences were simulated with the four non-uniform positional
composition sets: Low (panel A), Med-1 (panel B), Med-2 (panel C)
and High (panel D). The expected values of codon usage bias are
zero for all examined cases.
Conclusions
Figure 1 Codon usage bias across a variety of positional
background nucleotide compositions. Heterogeneous positional
background compositions were considered for GC content (panels A
to C) and purine content (panels D to E), respectively. The expected
values of codon usage bias are zero for all examined cases.
5.
6.
7.
8.
Sharp, PM, WH Li. 1987. The codon Adaptation Index--a measure of directional
synonymous codon usage bias, and its potential applications. Nucleic Acids Res 15:12811295.
Wright, F. 1990. The 'effective number of codons' used in a gene. Gene 87:23-29.
Zhang, Z, J Yu. 2010. Modeling compositional dynamics based on GC and purine contents
of protein-coding sequences. Biol Direct 5:63.
Zhang, Z, J Yu. 2011. On the organizational dynamics of the genetic code. Genomics
Proteomics Bioinformatics 9:21-29.
CDC accounts for background nucleotide composition to
estimate codon usage bias and utilizes a bootstrap assessment
to evaluate the statistical significance of codon usage bias.
As validated by simulated sequences and empirical data,
CDC outperforms extant measures by providing informative
estimates of codon usage bias and its statistical significance.
Further information
The proposed measure (CDC) has been published as a journal article.
Reference: Zhang, Z. et al 2012. Codon Deviation Coefficient: a novel measure for
estimating codon usage bias and its statistical significance. BMC Bioinformatics 13:43.
Contact: zhangzhang@big.ac.cn
Lab website: http://cbb.big.ac.cn


