Achieving NISBP Targets
advertisement
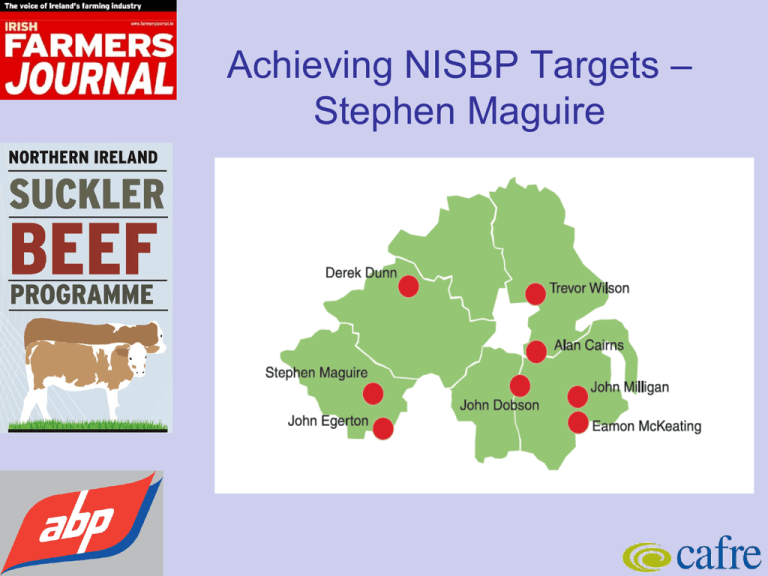
Achieving NISBP Targets – Stephen Maguire Starting Baseline NISBP Av farm size (Ha adj Grassland) Av Cow herd 118 (69ha owned) 93 Av Stocking rate (LU/ha) 1.65 Av GM/ha £248 Av Calving Index (days) 397 Av Kg LWT/ha 567 Farm Overview - 39 Ha farmed 2013 (51.1ha 2010) - High rainfall area > 50 inches annually - Traditionally suckler to weanling system - 50 suckler cows – Mainly Sim x lim - Charolais as terminal cross - Replacements purchased in calf - Old swards with low PRG content Herd fertility Calving index Calving Index 2010 2011 2012 2013 393 371 367 382 Age of heifers at calving Months 2010 2011 2012 2013 34 45 31.5 24.7 Calving spread J F M A M J 2010 (58) 11 11 12 13 10 1 2011 (67) 5 7 25 14 6 2 2012 (45) 4 11 19 10 1 2013 (52 12 10 23 7 2014 (60) 9 13 30 8 J A S O N D 3 3 2 Improvements in grass production Grass growth 2013 New -13.2tDM/Ha Old – 5.7tDM/Ha Improvements in grass management Rotational grazing Improved soil fertility Baseline Performance 2010 (54) 2011 (54) 2012 (50) Output 575 794 717 Grassland 56 84 110 Concentrates (Kg/cow) 73 (333) 38 (185) 67 (300) Vet, Med Sund. 55 97 65 TOTAL VAR 184 219 234 GROSS MARGIN 390 575 474 AREA (Ha) 51 45 44 GROSS MARGIN/Ha 413 706 539 Weanling system – 60 cows Weights and value based on 2013 performance Weight Value Total Value Steers (30) 311 630 18,900 Heifers (18) 277 550 9,900 Cull Cows (12) DWT 350 1000 12,000 Total output (£40,800 less 5% Mortality) = £38760 or £646 per cow Based on current variable costs GM per cow = £412 GM per Ha = £633 Opportunities to increase GM/Ha 1. Grass production currently exceeding stock demand 2012 - 362 tonnes excess silage 2013 – 278 tonnes 2. Increase cows / add value to weaned calf 3. Make better use of spring and autumn grass growth 4. Continue to improve herd fertility 5. Refine breeding of replacements Improvements in grassland management Carry over of stock capable of utilising spring grass Improvements in grassland management Earlier weaning of calves has allowed : 1.Extended autumn grazing of calves 2. Reduced silage demand for cows Target Performance Male calf management Kg LWT Birth 1st March 45 Housing 1st Nov Turnout 17th March Sale 31st May 290 385 460 LWG 1.0kg for 245days 0.7kg for 136days 1.0kg for 75 days Concentrate feeding Cow – 2kg/d (30days) Calf 1kg/d (60days) 2kg/day (136days) 1kg/day (30 days) 422kg Target Performance Female calf management Kg LWT Birth 1st March 40 Housing 1st Nov Turnout 17th March Sale 31st May 285 367 442 LWG 1.0kg for 245days 0.6kg for 136days 1.0kg for 75 days Concentrate feeding Cow – 2kg/d (30days) Calf - 1kg/d (60days) 2kg/day (136days) 1kg/day (30 days) 422kg Summary Aim to have 60 calves per year with 12 suitable heifers in calf Output - 30 Steers 440kgs @ £900 = £27,000 - 18 Heifers 420kgs @ £840 = 15,120 - 12 Cull Cow 350DW @ £1000 = 12,000 (£54,120) Less Allow 5% Mortality/ loss - £2706 Cost of replacing bull per yr - £1000 Total Output = £50,414 Grassland Meal & Straw Vet/Ai/Misc TOTAL VAR. - 8,600 - 6,451 - 3,900 - 18,951 TOTAL GROSS MARGIN = £31,463 TOTAL HECTARES (39) GROSS MARGIN PER HECTARE = £806 Summary Grassland cost Fertiliser – 96 acres @ 5bags/acre = 24tonnes@ £300/t = £7200 Lime – 10 acres per year @ £40/acre = £400 Grass seed – 10 acres per year @ £70/acre = £700 Sprays = £300 TOTAL GRASSLAND = £8,600 Meeting these targets - Maintain and improve herd fertility - Body condition management - Target bulling and calving weights - Use of maternal genetics - Continual improvement of grass production and utilisation - Refine rotational grazing plans - Silage budgeting - Monitor and address soil fertility - Continual monitoring of cattle performance. - Identify best & poorest performers - Defined animal health plan
