The Deal 2014_JBIMS_Mastermind
advertisement
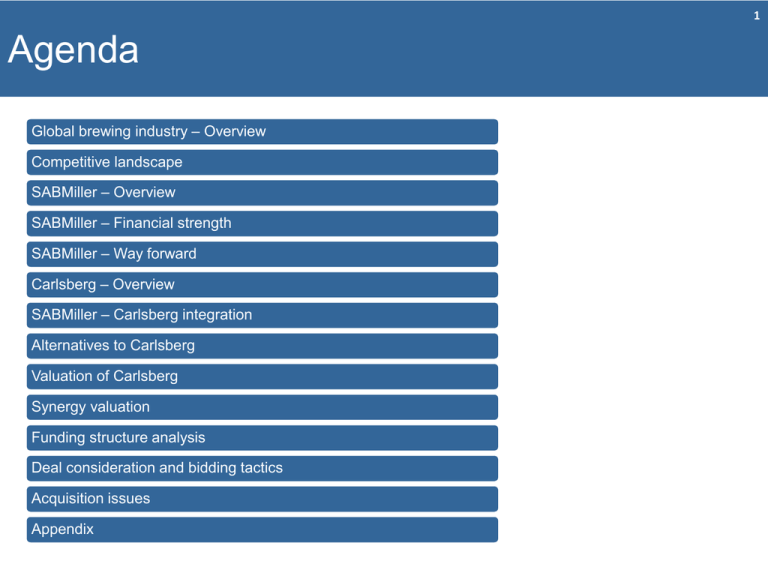
1 Agenda Global brewing industry – Overview Competitive landscape SABMiller – Overview SABMiller – Financial strength SABMiller – Way forward Carlsberg – Overview SABMiller – Carlsberg integration Alternatives to Carlsberg Valuation of Carlsberg Synergy valuation Funding structure analysis Deal consideration and bidding tactics Acquisition issues Appendix 2 Alcoholic beverages categories Alcoholic beverages Distillation Spirits Unsweetened ABV > 20% Players Diageo Pernod Ricard Bacardi Campari * ABV: Alcohol by volume Brewing Beers Flavored with hops ABV 4-6% Players Anheuser – Busch InBev SABMiller Plc Carlsberg Heineken Aging Wines Prolonged fermentation ABV 9-16% Players Constellation Brands E&J Gallo 3 Global brewing industry : Geographic In the past shifts Beer consumption - predominantly being driven by geographies like NA, Europe, Australia Mature markets –became more & more fragmented - Became an integral part of culture Stiff competition, slow growing consumer base – squeezing margins & declining growth - Remained no more a discretionary item of the expenditure Emerging markets became next frontier – on back of growing population & affluence Relativelyfirst large geographies – high population, high growth alignment potential were still untapped Obvious targets : - Latin America – cultural with Europe Prevalence of local beers in untapped – sans premiumization - SEgeographies Asia – growing affluence & rapid urbanization Next in line – China & India 4 Global brewing industry : Current scenario Per capita consumption of beer by region Global brewing sector region-wise segmentation by value Beer – region wise PLC stages Global brewing sector product segmentation by value 2% 3% 4% 25% 44% Europe Beer Asia Pacific Cider Americas FABs Rest of the World 94% 28% Source : Datamonitor, WHO 5 Global brewing industry : Future outlook Income v/s Beer consumption Beer consumption L/Capita 120 Germany 100 Denmark UK US 80 Russia South Africa Portugal Brazil China 60 40 Sweden Australia France 20 India 10000 20000 30000 40000 Income/Capita USD (PPP) 0 0 Mature markets – Saturation, cutback on spending, high unemployment levels - growth expected to be sluggish Emerging markets will fuel consumption - Expected socio-economic improvement, rising per capita income - High correlation between improving wealth and beer consumption • BRIC key to offset sluggishness - Increased focus of global brewers 50000 (Bn) Beer growth trends by volume (during 2011-15) Global brewing sector forecast 800 700 6% 600 0% 0 Source : Datamonitor, Research Reports E Europe Bn litres 100 W Europe 200 1% NorthAm $ Bn LatAm 300 2% Asia 400 3% Africa 500 4% Global 5% 2010 2011 2012 2013 Year 2014 2015 6 Competitive landscape Global brewers sector % share by value Profitability v/s Market concentration 35% AB InBev 30% 20% 25% SABMiller EBIT/hl ($) Carlsberg USA South Africa 15% UK 10% 5% Russia China India 0% Other 10% Japan 20% Heineken N.V. 13% 50% Brazil 0% 10% 20% 30% 40% 50% 60% 70% 80% 90% 100% 7% Concentration Regional market share v/s EBIT margin 100% 90% 80% 70% 60% 50% 40% 30% 20% 10% 0% EM MM Carlsberg Heineken AB InBev SABMiller Source : Company Reports, Datamonitor, Research Reports EBIT margin Top 4 Brewers market exposure 45% 40% 35% 30% 25% 20% 15% 10% 5% 0% ABI- LatAm North ABI-LatAm South ABI-North America CAR-East Europe SAB-LatAm HEI-Africa & Middle east 0% 20% 40% 60% Market share SAB-Soth Africa 80% 100% 7 Brewers : Market positions USA,: #1: ABInbev : (48%) (Budweiser, Stella Artois, Hoegaarden) #2: SABMiller #3: Heineken CANADA: #1: SABMiller (Miller Genuine Draft, Pilsner Urquell) #2: ABInbev #3: Heineken UK: #1: Heineken (26%) #2: ABInbev (22%) #3: SABMiller (20%) EUROPE: Highly fragmented market Brewers share leading positions in different countries RUSSIA: #1: Carlsberg (Carlsberg, Baltika, Tuborg) (39%) #2: ABInbev (18%) CHINA: #1: SABMiller (CRE - Snow) (20%) #3: ABInbev (11%) #5: Carlsberg LATIN AMERICA: #1: ABInbev (Brazil: 42%, Argentina: 69%) #2: SABMiller (Lat Am: 93%) #3: Heineken SOUTH AFRICA: #1: SABMiller (89%) #2: Heineken Source : Company Reports AUSTRALIA: #1: Foster’s (50%) #2: Lion Nathan (Kirin) (38%) 8 SABMiller : Building locally, winning globally Company that has grown out of acquisitions Geographical contribution to top line 23% 31% Lat Am Europe N.A. 1895 2003 2008 2% 2008 Africa Asia SA Vision : To be most admired company in global beer industry 13% 17% Key facts : 200 brands, 6 continents, 75 countries 30000 No. of breweries 7 25691 LatAm 17 14% No of employees ($ Mn) 25000 30,000 NorthAm 20000 12 Europe Africa 21 31 25,000 14239 15000 13481 11897 8800 10000 15,000 3358 5000 EBITA 10,000 0 8 20,000 Revenue Asia S Africa Financial snapshot LatAm NorthAm Europe Africa Asia S Africa 5,000 0 2007 2008 2009 2010 2011 Source : Company Reports 9 SABMiller : Threats & opportunities Threat from ABInBev - Having realized more than 90% of the total $2.5 Bn of cost synergies from integration in 2008 is at more than comfortable debt level with debt/EBITDA almost reaching 2.0x - Potential comeback of M&A on strategic agenda - With gloomy scenario in NA due to spend cuts, unemployment at 9% leading to squeezing margins AB will look to strengthen its position in EMs like LatAm & Asia SABMiller’s massive exposure to emerging markets -requires sustained investments and demand for higher FCF generation Rising raw material and crude prices pushing transportation costs higher 30% of SABM’s net profit comes from its associates like Molson Coors & CRE – sizeable, cash hungry and less controlled by SABM, leading to shared access to the associates’ cash flows Dominance of mega retailers – increased control on margins, introduction of private labels - This may lead to AB eating away SAB’s pie from its stronghold markets Associating with an established player in emerging markets who can generate cash on a sustainable basis Market share consolidation may give increased negotiating power with retailers and suppliers 10 SABMiller : Financial strength D/E Ratio (x) 0.80 0.60 Debt/EBITDA (x) 2.5 0.64 0.54 0.51 2 0.46 0.36 0.40 2.1 2.1 1.8 DSCR (x) 0.80 2.0 1.6 1.5 2007 2008 2009 2010 2011 0.47 0.48 0.50 2008 2009 2010 0.20 0.5 0.00 0.63 0.54 0.40 1 0.20 0.60 0 0.00 2007 2008 2009 2010 2011 2007 Leverage No current plans of accelerating distribution of funds to shareholders Funds are primarily diverted towards keeping the leverage levels within targeted 1.5x – 2.0x debt/EBITDA range Ratio of CFO/debt has been increasing continuously over the last 3 years – 32-38% in 2008 to 48% in 2011 Average debt maturity decreasing - 4 years in 2011 & which was 4.7 years in 2010 Liquidity In position to generate strong medium term FCFs despite capex & dividends distribution Generated discretionary cash flows of $1.4 Bn over the last two years $3.2 Bn of undrawn committed credit facilities $1.1 Bn of cash available against $1.3 billion short term maturities Free Operating Cash Flows ($ Mn) 3,000 2,500 2,000 1,500 1,000 500 0 2507.9 2564.9 1552.6 2007 831.5 740.3 2008 2009 Source : Company Reports 2010 2011 Financial position Strengthening – availability of free cash & reducing leverage Sufficient headroom under company’s debt covenants In position to improve price/mix to mitigate volatile agro commodities costs, negative currency effects & weak consumer sentiment SABMiller comfortably poised to make provisions for additional means of financing to fund further growth plans 2011 11 Way forward SAB can look for complementing the group’s current footprint with a well established local business With such a move SAB can strengthen its position in LatAm & Africa which will help it pose its defenses against a possible advent of AB Consolidation in Asia not only will increase Asian region’s contribution to its top line but also will take it to such a level which will make it difficult for AB to counter SAB can gain significant scale advantage over its other peers as well Growth Option Advantage Disadvantage Previous Example Build Cheaper Uncertain Castle Lager Befriend Cross Selling Cannibalize Molson Coors Acquire Brand Access Premium Peroni 12 Carlsberg : Brand as many, but stand as one Vision : To be the fastest growing global beer company Regional presence with no. of breweries ($ Mn) Profitability 14000 12000 10000 8000 Revenues 6000 Profits 4000 27 10 2000 0 2006 2007 2008 2009 2010 Q2LTM 7 Regional break - up Revenue ($ Bn) (outer) Volume (Mn hl) (inner) 19 6 18 4 N W Europe 1.1 E Europe 50 3.5 6.9 3rd largest market share holder globally 47 Key facts : 200 brands, 2 continents, 50 countries One of the earliest to go for internationalization, but not as aggressive as competitors in market penetration After establishing stronghold in Russia, poised to embark on Asian growth with sustained expansion in China & Indochina Source : Company Reports Asia 13 SABMiller – Carlsberg integration Geographic footprint of Carlsberg - highly complementary to that of SABMiller 296.4 Combined Entity scenario 121.1 115.3 55.3 21% 20% SAB + Carlsberg ABInbev Market share (%) Revenues ($bn) 50% 9% Heineken Others Combined entity will be the largest player in China, S-E Asia, Germany, UK Combined entity SABMiller : Emerging Markets (EM) Mature Markets (MM), Carlsberg : MM EM, Enhanced regional strength in EMs Increased concentration in EMs & resulting market dominance of combined entity will be key driver to profitability Financials comforting the level of debt & liquidity Enhanced FCF generating ability of the combined entity will satiate the overlapping need for capex required for strengthening position in emerging markets 14.0% Free cash flow yield (2011E) 12.0% 10.0% 8.0% SABMiller’s dependency on associates for cash generation from emerging markets will shift to combined entity 6.0% 4.0% 2.0% 0.0% AB Inbev Source : Company Reports, Datamonitor SABMiller Heineken Carlsberg SABMiller + Carlsberg 14 SABMiller – Carlsberg integration Complementary product portfolios Absence of a flagship premium brand from SABMiller’s product portfolio will be filled by the crown jewel – ‘Carlsberg’ – possible launch in markets like LatAm and NorthAm Carlsberg’s energy and soft drink business - natural diversification of SAB’s portfolio – building image in health conscious society Carlsberg’s new repositioning strategy can be leveraged upon to launch SAB’s local brands in E Europe & NW Europe markets Operational efficiencies – economies of scale, higher negotiating power with suppliers & retailers Access to each other’s breweries – benefits of economies of scale along with optimization SABMiller’s bottling plants can be expanded to accommodate Carlsberg’s products Carlsberg’s SKU rationalization & standardization strategy can be extended to SAB’s products Synergies through cross utilization of human resources Sales & marketing synergies R & D – Combined effort would be even more fruitful Carlsberg’s development of a new yeast strain, together with a relatively new high yielding strain of barley will help keeping beer fresher for longer. This is of particular importance in emerging markets, such as India and Russia, with long transport hours and hot warehouses in summer months SABMiller’s new low gauge beer crown is expected to reduce requirement of steel by 10%, leading to annual cost savings of about $ 12 Mn in material costs alone (Backus’s design uses 0.17 mm gauge, instead of the industry standard of 0.22-0.24 mm) Strategic fit Both the companies follow the strategy of premiumization of local brands 15 Alternatives to Carlsberg Heineken NV Market Cap ($ Mn) Market Price ($) Trailing P/E (x) Debt to equity (x) 28,737 59.57 14.52 0.8 Financial snapshot 25,000 Anadolu EFES 3,000 Market Cap ($ Mn) Market Price ($) Trailing P/E (x) Debt to equity (x) 8,775 21.95 18.39 0.27 Financial snapshot 2,500 20,000 2,000 15,000 10,000 Revenue ($ Mn) 1,500 Revenue ($ Mn) PAT ($ Mn) 1,000 PAT ($ Mn) 500 5,000 0 0 2006 2007 2008 2009 2006 2010 Region wise revenue break-up (%) 4% 7% 47% 2008 2009 2010 West europe Central & east Europe 3% 35% Turkey Family driven holding structure Smaller footprint in other EMs Source : Company Reports, Datamonitor 2007 2008 2009 2010 5% 63% Alcoholic Beverages Soft drinks 26% Food Moldova Georgia Next best alternative for Carlsberg Strong footprint in Africa and scope for market share consolidation in MM PAT (Mn) 6% Asia Pacific 19% Revenue (Mn) Category wise revenues (%) Kazhakhstan The Americas 12% 9,513 19.99 13.74 0.61 Financial snapshot 2006 Russia Africa & Middle East Market Cap ($ Mn) Market Price ($) Trailing P/E (x) Debt to equity (x) 20,000 18,000 16,000 14,000 12,000 10,000 8,000 6,000 4,000 2,000 0 Region wise revenues (%) 1% 21% 2007 Asahi Holdings Others 51% 5th largest in Europe and 13th in the World 5th largest bottler for Coca Cola Market leader position in Japan can be leveraged upon to expand further Smaller geographic footprint Relatively new player, no big brands Product portfolio too diversified to be a pure brewer 16 Projections and sensitivity to macroeconomic factors Growth drivers : - Price/mix in mature markets - Volume in emerging markets - Product mix – catering to all consumer segments (economy – standard – premium beer) Carlsberg projections Macroeconomic factors sensitivity 30.00 Carlsberg revenue change (%) & Real GDP change (%) 25.00 ($ Mn) Revenues Carlsberg 20.00 16,000 14,000 Euro Area 15.00 Emerging Europe 10.00 Emerging Markets 5.00 12,000 Net income 10,000 0.00 1Q09 2Q09 3Q09 4Q09 1Q10 2Q10 3Q10 4Q10 1Q11 2Q11 -5.00 EBIT -10.00 8,000 EBITDA -15.00 Revenues 6,000 30.00 Carlsberg revenue change (%) & Consumer price change (%) 25.00 4,000 Revenues Carlsberg 20.00 2,000 Euro Area 15.00 0 Emerging Europe 10.00 2008 2009 2010 2011 2012 2013 2014 2015 2016 Emerging Markets 5.00 0.00 1Q09 2Q09 3Q09 4Q09 1Q10 2Q10 3Q10 4Q10 1Q11 2Q11 -5.00 -10.00 Source : IMF, Company Reports -15.00 17 DCF valuation and sensitivity Carlsberg Base WACC WACC (%) 7.94 Beta 30% 33% 36% 39% 42% 0.77 7.7% 7.7% 7.6% 7.6% 7.5% 7346.5 0.82 7.8% 7.8% 7.7% 7.7% 7.6% NPV of Terminal Value ($ Mn) 18753.7 0.87 8.0% 7.9% 7.9% 7.8% 7.8% Value of Firm ($ Mn) 26100.2 0.92 8.1% 8.1% 8.0% 7.9% 7.9% Value of Debt ($ Mn) 9089.6 0.97 8.3% 8.2% 8.1% 8.1% 8.0% Long Term Growth (%) 2 Forecast Period 2011 to 2016 NPV of Forecasted Cash Flows ($ Mn) Value of Equity ($ Mn) Debt ratio 17010.6 Number of Shares ($ Mn) 152.6 Share Price ($) 111.50 Price sensitivity WACC v/s Growth rate (in $) Value in $ 1.00 WACC (%) 145.00 Growth rate (%) 1.50 2.00 2.50 3.00 8.14 88.52 96.60 105.99 117.04 130.25 8.04 90.61 98.96 108.70 120.19 133.97 7.94 92.76 101.40 111.50 123.46 137.84 7.84 94.97 103.92 114.41 126.85 141.87 7.74 97.25 106.53 117.41 130.38 146.08 8.04 120.00 7.94 7.84 7.74 95.00 7.64 70.00 1.00 1.50 2.00 2.50 Growth rate (in %) 3.00 18 Transaction and trading comparables Carlsberg CMP :: $107.62 as on 30th June 2011 Rev/share :: 78.31 (Calenderized) EPS ($) :: 6.37 (Calenderized) EBITDA/share :: 16.68 (Calenderized) Trading Comparables Transactions Comparables Peers Heineken Kirin Foster's Asahi Molson Coors P/E 2011e 14.30 15.80 19.80 13.60 12.60 EV/EBITDA 2011e 7.40 5.90 9.80 6.60 7.90 EV/Rev 2011e 1.70 0.90 5.0x 0.90 1.30 Anadolu Efes 18.40 10.00 2.30 Primary Peers 15.75 7.93 1.42 Implied Price/share ($) 100.40 132.33 111.20 Date Acquirer Target FV/Rev FV/EBITDA Jun-10 Carlsberg Chongqing Brewery 8.8 49.4 Jan-10 Heineken Femsa 2.34 10.9 May-09 Asahi / Mr Chen Fashu Tsingtao Brewery 1.42 13 Apr-09 Kirin Holdings Lion Nathan 3.59 12.2 Jul-08 InBev Anheuser-Busch 2.9 12.5 Scottish & Newcastle 2.49 13.6 Grolsch 2.74 14.4 2.74 13.00 Jan-08 Heineken/Carlsberg Nov-08 Median Carlsberg share price (in $) Trading comparables Transaction comparables Source : J P Morgan PIB SABMiller FV 108.95 154.34 Net Debt Equity Value No of shares Price/shre FV/Rev 32807.75 9089.62 23718.13 152.6 155.47 FV/EBITDA 32463.20 9089.62 23373.59 152.6 153.21 19 Valuing synergies Synergies : $19.43/share (Bull case), $9.71/share (50% realization) and no synergies (Bear case) EBITDA margin improvements • COGS : Extending raw materials cost reduction programs ~ 200-250 bps • Operating expenses : Optimization & cross mobilization of human resources ~ 200 bps • SD&A expenses : cross utilization of sales & distribution network ~ 300 bps Economies of scale • Higher negotiating power with suppliers & retailers • Revenue/brewery: Increases, moves towards SABMiller numbers Growth rate -Tiding over the crisis • Declining growth rate in European region is expected to stabilize with consolidation • Launch of Carlsberg brands in unexplored markets of Americas & Africa ~ 150- 200 bps • Consolidation & market dominance in Asian region ~ 200 bps • Elongation of explicit time horizon by 2 years due to global market leadership position Finance - Increased borrowing capacity • Improved credit rating & higher debt capacity • Higher cash flow yield Key factors • Enhanced geographic presence • Complementary portfolios • Strategic fit 20 Pricing summary CMP 3M 6M 12M Broker Target EV/EBIDTA EV/Sales P/E DCF Bull Case FV/Sales (T) FV/EBIDTA (T) 25 50 75 100 125 150 175 200 225 250 21 Funding structure analysis All cash offer Part cash part equity All equity share swap Swap ratio (52 wk avg mark cap) ~ 3.8 Using 100% of cash available with Swap ratio based on revenues ~ 7.9 SABMiller ~ $1.07 Bn Using 100% of cash available with SABMiller ~ $1.07 Bn Debt to be raised ~ $18.91 Bn Swap ratio based on EBITDA ~ 5.5 Raising debt of $4.52 Bn on SABMiller Raising debt on SABMiller ~$12.65 Bn Ceiling swap ratio of 4.5 Issuing 393 Mn shares of SABMiller Infusion of $13.72 Bn in an SPV Issuing 710 Mn shares of SABMiller Ceiling swap ratio of 2.57 Raising debt on SPV ~ $6.26 Bn Cash : equity ~ 28:72 Outstanding shares ~ 1.59 Bn Outstanding shares ~1.59 Bn2.30 Bn Outstanding shares ~1.59 Bn1.98 Bn Pledge Carlsberg shares against debt No additional debt to be raised Additional debt is within comfort level Higher interest costs Interest costs to remain same Slightly higher Interest costs - SABMiller ~ 8.44% 9.50% - SABMiller ~ 8.44% - SABMiller ~ 8.44% 9.00% - Carlsberg ~ 8.86% 10.00% - Carlsberg ~ 8.86% - Carlsberg ~ 8.86% I- Banking fees ~ $50 Mn I- Banking fees ~ $50 Mn 2011e 2012e 2013e SABMiller standalone 1.38 1.49 1.61 1.78 With Synergy 1.45 1.65 0.07 0.17 Effect on EPS 0.07 1.53 1.74 Part Synergies (50%) 2011e 2012e 2013e SABMiller standalone 1.38 1.49 1.61 1.79 With Synergy 1.53 1.76 1.94 0.16 0.19 Effect on EPS 0.15 0.27 0.33 1.43 1.62 1.77 Part Synergies (50%) 1.51 1.74 1.91 0.13 Effect on EPS 0.05 0.13 0.16 Effect on EPS 0.13 0.25 0.30 1.41 1.60 1.74 Bear case 1.49 1.71 1.87 0.03 0.11 0.14 Effect on EPS 0.11 0.22 0.27 2011e 2012e 2013e SABMiller standalone 1.38 1.49 1.61 With Synergy 1.28 1.56 Effect on EPS -0.10 Part Synergies (50%) 1.25 Effect on EPS -0.13 I- Banking fees ~ $50 Mn 0.04 Bear case 1.22 1.49 1.70 Bear case Effect on EPS -0.16 0.00 0.10 Effect on EPS 22 Post acquisition creditworthiness All cash offer Pre-acquisition Post acquisition Debt/EBITDA 5.00 SABMiller Debt/EBITDA 2.00 Carlsberg Debt/EBITDA 1.00 0.50 0.00 2011e 2012e 2.00 Part Synergies (50%) 2013e Carlsberg EBIT/Interest 0.00 2011e 9.00 6.00 1.50 8.50 4.00 1.00 8.00 2.00 0.50 7.50 0.00 0.00 2013e 2011e 2012e 2013e 2012e 2013e 2011e 9.00 Post acquisition EBIT/Interest 2.50 2.00 Bear case 0.50 0.00 2012e 8.00 2012e Part Synergies (50%) 1.00 Bear case 1.00 9.50 2011e With Synergy 1.50 3.00 SABMiller EBIT/Interest Post acquisition Debt/EBITDA 2.50 With Synergy 2.00 2011e 2013e 4.00 3.00 3.00 2.50 2.00 1.50 1.00 0.50 0.00 1.50 All equity share swap offer 2012e 2013e Post acquisition EBIT/Interest 8.00 7.00 With Synergy With Synergy 6.00 5.00 Part Synergies 4.00 (50%) 3.00 Bear case 2.00 Part Synergies (50%) Bear case 1.00 0.00 2011e 2012e 2013e In case of all cash offer Highly levered combined entity, high debt/EBITDA, low interest coverage ratio Strained debt position even in case of 100% synergy realization Expected to reach level of comfort (3.5x) over a period of 3-4 years Negative impact on credit rating – higher credit spreads In case of all equity share swap Combined entity – moderately levered, average debt/EBITDA and interest coverage ratio Comfortable debt level even if no synergies are realized Possibility of a credit rating upgrade 2011e 2012e 2013e 23 Deal consideration and bidding tactics Shareholding pattern of Carlsberg Carlsberg Foundation ~ largest shareholder with 30.33% equity stake and 74.16% of the voting rights (‘A’ shares) Common shareholders ~ 69.67% equity holding and 25.84% of the voting rights (‘B’ shares) Board approval is a pre-requisite due to internal take over defenses in place Unsolicited friendly offer to promoters Proposal to do the business together with Carlsberg being 100% subsidiary of SABMiller Start with a considerable premium Equity share swap offer with exchange ratio of 3.60-4.20 Willing to be a part But offer is not acceptable Consequent offer with an exchange ratio of 4.20-4.50 Final offer at an exchange ratio of 4.66 Offering MD’s position on rotating basis Offering CXO level positions Offer same exchange ratio of 3.60 – 4.20 and an exit option after 5 years at then prevailing fair market value If not willing to be a part of business Exit option can be provided by offering 100% cash with a bid price of $121 per share If willing to exit but offer is not acceptable Consequent offer s firstly at $127 per share and then $130 per share which will be the ceiling price Promoter approval will trigger Danish take over code ~ majority of voting rights Open offer to common shareholders for remaining 70% stake at same price as promoters ~ Danish take over laws 24 Acquisition issues Post merger management and employee integration issues - SAB’s growth has primarily been inorganic in nature whereas that of Carlsberg has been organic in nature - SAB’s management is mainly based out of emerging markets whereas that of Carlsberg is mainly based out of mature markets - This may lead to integration issues (aligning the interests of management and executives) Acquisition may be challenged on anti trust grounds Legal Issues - Stitching: Carlsberg can acquire another company and enter into a Stitching Agreement in Netherlands, making SABMiller’s bid for Carlsberg more expensive and potential acquisition more difficult Pre-merger take over defenses by Carlsberg - White Knight/ White Squire - Carlsberg can merge with another brewer - Crown Jewel Defense: May sell off important Carlsberg brands Sentimental attachment to “the Carlsberg Brand” Potential Political Intervention - Introduction of new laws/ Change of existing laws SABMiller may incur higher debt raising costs due to global financial crisis and worsening debt markets 25 Appendix Case materials provided by JP Morgan Company Reports Datamonitor Research Reports
