New technologies
advertisement
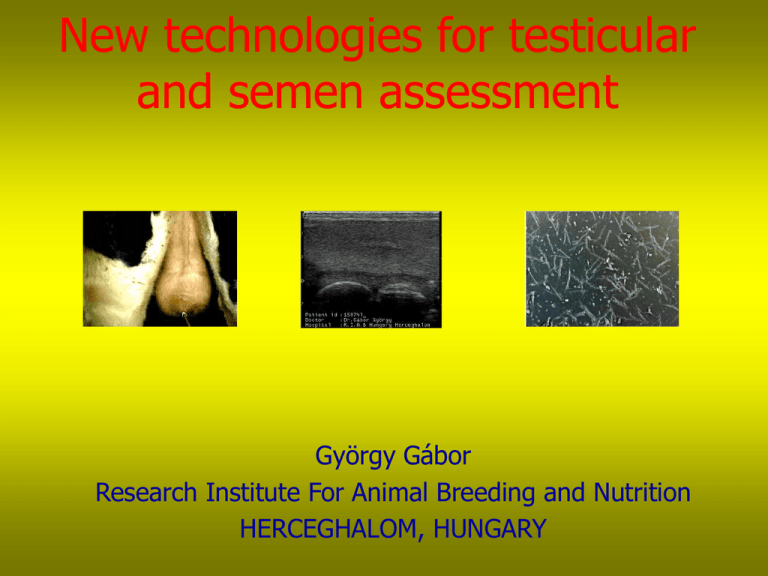
New technologies for testicular and semen assessment György Gábor Research Institute For Animal Breeding and Nutrition HERCEGHALOM, HUNGARY Introduction The aim of the examinations is: • to determine if ultrasonic echotexture is associated with semen production of bulls and boars • to select those young bulls which are certainly not useful for the AI before the semen examination • check semen quality by an objective instrument method (dog, bull, boar, ram) • develop a bull andrological data base Material and Methods • Examined animals: • • • H-F AI bulls 6-18 months of age in several examinations between 1998 and 2000 breeding boars (different breeds) 10-60 months of age between 19982000 breeding male dogs (different breeds) 14-86 months of age between 1999-2000 • Morphological examinations: • scrotal circumference (SC): Coulter scrotal tape (bulls) • scrotal form: digital camera (bulls, boars; storing format: jpg) • testicular consistency (Consitest electronic tonometer; bull, boar) Coulter Scrotal Tape Scrotal forms (bulls) Scrotal forms (boars) Examination of the testicular echotexture (bull, boar, dog) • The ultrasonic examination of the testes was done with a Bmode scanner (Pie Medical, Model 100 LC VET) with an 8 MHz linear-array transducer. Gain was held constant for all examinations. • The transducer was aligned at the center of each testis and perpendicular to the vertical axis. A custom, electromechanical device for holding the probe was used to assure that the same pressure was applied by the probe against tissues upon which liberal amounts of ultrasound coupling gel had been applied (except with dogs). • At approximately 0.8 kg/cm2 pressure a spring-loaded switch was compressed. At that instance, the ultrasound image was frozen on the scanner and the image was stored. Examination of the ET by the help of an electronic (auto image freezing function) transducer’s holder Consitest electronic tonometer (bull, boar) • The spring loaded measuring heads use 1500 grams of pressure at all times. Because of the difference in dimension of the two heads (1:3), the penetration to the observed tissue will be different. The transmission changes from a linear movement to a circular movement. A rotating code disk interrupts the infrared light, which counts the impulses for the microprocessor, which then summarizes the results and presents it on the display. Evaluation of the echotexture (ET) by Scanner 100 left testis right testis • The ultrasonic images of left and right testicles are recorded on disk. The average gray level were characterized on a 256 gray scale: 0 (dark) and 255 (light). TesTracto software (developed for the data base) was used for the evaluation of the ultrasonic ET New New development of the software: distribution evaluation of the gray levels Ultrasonic examination of the prostate in dogs Diameter:>5.5 cm Echodenz spot Echo poor area Semen samples and evaluation • Samples: • fresh: boar • frozen: bull, dog • Evaluation: • the total number of spermatozoa per ejaculate (TNS), the percentage of the live and motile spermatozoa by CASPAR software (Makler chamber was used to keep the 10 mm depth) Using CASPAR for the semen evaluation Statistical analysis • Mean values and Person correlation coefficients • true positive and negative diagnosis • false positive and negative diagnosis • positive prediction value Results 1. Morphological and semen (CASA) data BULL (n=25) BOAR (n=14) Age (mo) 14.0 ± 2.7 12.3 ± 4.7 SC (cm) 32.9 ± 4.1 - TM (mm) 4.9 ± 1.2 7.2 ± 1.4 ET (0-255) 44.7 ± 18.0 56.3 ± 6.0 Live % 71.0 ± 10.8 79.0 ± 10.2 Linear % 68.0 ± 8.6 47.3 ± 11.6 Speed (mm/s) 96.9 ± 10.9 50.7 ± 7.8 - 6.1 ± 1.0 Scrotal skin (mm) 2. Correlation coefficients and probabilities BULL BOAR Age vs. ET -0.12 (NS)* -0.81 (P<0.001) Age vs. SC 0.87 (P<0.001) - Age vs. Live % 0.45 (P=0.02) 0.30 (NS) SC vs. Live % 0.49 (P=0.01) - ET vs. Live % -0.46 (P=0.02) -0.37 (NS) ET vs. Scrotal skin - -0.81 (P<0.001) TM vs. Scrotal skin - 0.37 (NS) -0.23**(NS) 0.40 (NS) TM vs. Live % Usually around -0.50, significant ** Usually it’s a positive, significant correlation * 3. Correlation coefficients and probabilities for H-F bulls with visually examined semen data (n=88) SC AGE 0.6453 0.0000 SC 1.0000 0.0000 ET 0.2772 0.0093 TM 0.5287 0.0000 SV 0.3719 0.0004 SD 0.0519 0.6333 TSN 0.3390 0.0013 LIVE 0.4051 0.0001 ET TM SV -0.3921 0.3558 0.5574 0.0003 0.0007 0.0000 0.2772 0.5287 0.3719 0.0093 0.0000 0.0004 1.0000 0.7014 -0.0895 0.0000 0.0000 0.4098 0.7014 1.0000 0.1312 0.0000 0.0000 0.2257 -0.0895 0.1312 1.0000 0.4098 0.2257 0.0000 -0.0407 -0.1184 0.2466 0.7084 0.2748 0.0213 -0.0865 0.0450 0.8822 0.4259 0.6787 0.0000 -0.0666 0.0485 0.5059 0.5398 0.6555 0.0000 SD TSN LIVE -0.1767 0.3887 0.3557 0.1016 0.0002 0.0007 0.0519 0.3390 0.4051 0.6333 0.0013 0.0001 -0.0407 -0.0865 -0.0666 0.7084 0.4259 0.5398 -0.1184 0.0450 0.0485 0.2748 0.6787 0.6555 0.2466 0.8822 0.5059 0.0213 0.0000 0.0000 1.0000 0.5136 0.1965 0.0000 0.0000 0.0681 0.5136 1.0000 0.5325 0.0000 0.0000 0.0000 0.1965 0.5325 1.0000 0.0681 0.0000 0.0000 4. Categories of diagnosis (just for bulls) * Based on SC, ET and TM. Examination of the bulls was performed at least 2 months prior to the semen production. * Semen was measured for at least 2 months after the beginning of the semen production: SV, SD, TSN • NP - No predicted semen production problem • PP - Possible predicted semen production problem • NUAI - Prediction: not useful as a breeding bull 5. Prediction results in 1998 NP PP UAI Number of DG 49 41 4 Correct DG 47 22 4 Incorrect DG 2 19 0 Sensitivity 0.71 Specificity 0.94 Positive prediction value Negative prediction value 0.61 0.96 6. Prediction results in 1999 NP PP UAI Number of DG 42 52 3 Correct DG 39 35 3 Incorrect DG 3 17 0 Sensitivity 0.69 Specificity 0.93 Positive prediction value Negative prediction value 0.69 0.93 Possible reasons of the incorrect predictions Calcification. Dg.: PP normal semen production 6 months later Small SC (20 cm at 8 months of age normal SC size (32 cm) and semen production4 months later Possible reasons of the rejection Cryptorchidism Left testis: orchitis right testis: fibrosis Results of the dog semen freezing Examined dog Semen collection Oligospermia Aspermia Freezing Good quality of thawed semen 17 14 3 2 11 8 Conclusions • The morphological parameters (SC and ET, possibly TM) of testis and scrotum reflect semen measurement. • Andrological data bases for males help define the “gold standards” of these markers at different age levels prior to semen production and assist in identifying young bulls which are not useful to the AI industry.

