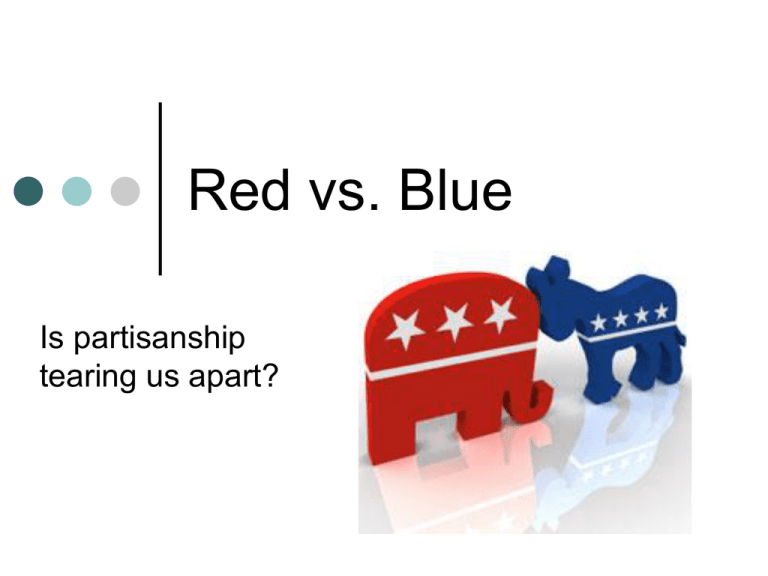
Red vs. Blue
Is partisanship
tearing us apart?
The map
that
started it
all, 2000
I. The “Red vs. Blue”
Narrative: Some Propositions
A.
The Pundits’ Story (clarified):
1.
2.
3.
4.
Identity: Party identity has become an
important part of self-identity, so that Red (proRepublican) and Blue (pro-Democrat) are as
salient as religion, race, place, etc.
50/50 Nation: The Red/Blue divide splits
America down the middle
Polarization: The Red/Blue divide has been
growing over time
Geographic Divide: Red America is a very
different place than Blue America
B. The Polarized Public?
Abramowitz’s Argument
5.
6.
7.
[Polarization is increasing among
ordinary people] (included in # 3)
Race, class, ideology, cultural views,
and geography are reinforcing rather
than cross-cutting cleavages
The Tea Party movement is an
example of a radicalized mass
movement
II. The identity thesis
Have
Americans
become
more
attached to
their
parties?
A. Party Images
From Mark Brewer, Party Images in the American Electorate, 2009.
1.
2.
Party image = “Mental picture” that
individuals have about a party
Can be treated as “likes” and “dislikes”
a. Party images getting
stronger – barely…
b. What do Americans see in
their major parties?
See Handout
c. Party images are more
distinct, more salient
B. Partisan Loyalty:
Increasing or Decreasing?
Increasing
references
in media
But is it real
or a myth?
1. Party Identification – Long-Term
Increase in Independents
2000 2004 2008 2012
2. Party Leaners – Few “Pure”
Independents but many “Independent”
leaners
3. Leaners look like “closet
partisans” (80% vs. 90% loyal)
C. Party Salience – How
important are partisan ties?
1.
Civic engagement – how important is politics?
a. Attention to political news:
Historical Perspective
b. Volunteerism: high…
…but not usually political
c. Salience of politics
Question: “Suppose that you alone
could determine whether a Democrat
or a Republican represents your
Congressional district by paying a
specific dollar amount? How much
would you be willing to pay to ensure
that a Congressman from your
preferred party will win the office?”
Answer (yougov.com): 55% of
respondents said “ZERO”
d. Political Activity (2008)
Turnout
III. 50/50 Nation?
Closeness and Depth
A.
Is the Country Closely Divided?
1.
Multiple Scholars: Yes. Elections 2000 and
2004 were close, and…
2. House Vote: Much closer than
most of 1950-1990
2010
3. Partisan Leanings (not ID) –
Nearly Even
B. Polarization: Are
Americans Deeply Divided?
1.
Issues (Fiorina): No. See Figures 3.2 and
3.4. Centrism on ideology and major
issues. But see also Abramowitz.
Further examples…
Abortion: Most in the middle
Gay Marriage: Substantial
Center Exists
Afghanistan (2009):
Substantial Middle Ground
Health Care: Evidence of
Polarization
2. Changes in Party Identification
Show Moderation Not Polarization
2000 2004 2008 2012
3. Ideology:
a. Public much less divided than
politicians (2006)
b.
State-level
Ideology: no
evidence of
sharp divide.
Centrists
dominate
most states
Fiorina: Gap is
an artifact of
“winner takes
all” – voters
similar in both
kinds of states
c. Even partisans are crosspressured
Most partisans disagree with own party on
at least one salient issue (common in 20002004: abortion, gay marriage)
Creates opportunities for persuasion during
campaigns
Many apparently divisive issues are really
“wedge” issues meant to peel off crosspressured partisans, not (just) to excite the
base
4. Comparative Evidence
(2008): Larger gaps between
partisans than other countries
C. Conclusions
Americans are closely divided competitive
elections at national level
Americans are centrists on many “wedge”
issues creates cross-pressured voters
Evidence on public polarization is mixed,
depending on issue and measure of opinion
Need more precise measures of polarization –
would allow comparison over time
IV. Is Partisan Polarization
Increasing?
A. Is Elite Partisanship
Increasing?
1. Introducing NOMINATE scores: An
unbiased method for measuring political
differences
a. Assumption 1: Political decisions are
connected – position on one issue helps
to predict position on other issues
b. Assumption 2: Whatever connects issue
positions is a continuum, so we can rank
people on this underlying dimension
2. Finding the underlying
dimension: An example
Three
legislators,
four bills (A
through D).
What rankordering best
explains
these voting
patterns?
Jose
Keisha
Pat
A
Y
Y
N
B
Y
N
Y
C
N
N
Y
D
Y
N
Y
a. Rank-Order the legislators
Options:
JKP
JPK
KJP
KPJ
PJK
PKJ
Jose
Keisha
Pat
A
Y
Y
N
B
Y
N
Y
C
N
N
Y
D
Y
N
Y
a. Rank-Order the legislators
Options:
JKP
JPK
KJP
KPJ
PJK
PKJ
Jose
Keisha
Pat
A
Y
Y
N
B
Y
N
Y
C
N
N
Y
D
Y
N
Y
a. Rank-Order the legislators
Options:
JKP
JPK
KJP
Jose
Keisha
Pat
A
Y
Y
N
B
Y
N
Y
C
N
N
Y
D
Y
N
Y
b. Rank-Order the Bills
Options:
ABCD
ABDC
ACBD
ACDB
ADBC
ADCB
BACD
BADC
BCAD
BDAC
CABD
CBAD
Jose
Keisha
Pat
A
Y
Y
N
B
Y
N
Y
C
N
N
Y
D
Y
N
Y
c. Evaluate the RankOrderings to Predict Votes
Iss. Rank
JKP
JPK
KJP
ABCD
ABDC
ACBD
ACDB
ADBC
ADCB
BACD
BADC
BCAD
BDAC
CABD
CBAD
A
J Y
K Y
P N
B
Y
N
Y
C
N
N
Y
D
Y
N
Y
i. Check each combination
First combination to check: JKP and ABCD
J
A
K
B
P
C
D
Implications:
J more likely to vote for A than K 0
J more likely to vote for A than P 1
K more likely to vote for C than J 0
K more likely to vote for D than J -1
K more likely to vote for A than P 1
K more likely to vote for B than P -1
P more likely to vote for D than K 1
P more likely to vote for D than J 0
A
J Y
K Y
P N
B
Y
N
Y
C
N
N
Y
D
Y
N
Y
ii. Now re-check with different
policy positions
First combination to check: JKP and ABCD
J
K
ABC
A
BC
A
A
P
D
D
BCD
B CD
Etc…
A
J Y
K Y
P N
B
Y
N
Y
C
N
N
Y
D
Y
N
Y
iii. Repeat for every possible
combination
NOMINATE scores generated using a
supercomputer
Note that none of the possible
orderings is likely to be correct all of
the time, given dozens or hundreds of
legislators and bills (all roll-call votes
in which 2.5% or more disagree)
d. Which combination
performs best?
Iss. Rank
JKP
JPK
KJP
ABCD
17
7
4
ABDC
23
11
-2
ACBD
11
-2
12
ACDB
-5
0
17
ADBC
14
9
13
ADCB
9
12
9
BACD
4
17
22
BADC
2
6
26
BCAD
13
11
2
BDAC
19
-2
21
CABD
21
21
-4
CBAD
-1
24
13
Possible
Implication:
K loves B and
hates C, while
P loves C and
hates B.
Everyone and
everything else
is moderate.
Example: 110th Congress by
D-NOMINATE Scores
e. Now suppose there are
multiple dimensions….
Examples:
Social freedom vs Economic freedom
International cooperation and international militancy
All of the above (4 dimensions!)
Authors find one or two dimensions are all that is needed:
Currently just one (liberal vs. conservative).
Very high (.81) correlation with hand-coded scores of
liberalism vs. conservatism – the computer found
something that matches our understanding!
Sometimes a second dimension (Regionalism: North-South
power balance, bimetalism/free silver, civil rights)
Opposition to Civil Rights
Example: 91st House (1969-70)
Conservatism
3. What can NOMINATE tell
us about polarization?
1.
2.
3.
4.
Whether there are two dimensions or one:
Is the liberal-conservative continuum a
good way to categorize politicians?
How far apart each party’s legislators are
from each other (party unity)
How far apart one party’s legislators are
from the other party’s legislators
(polarization)
Whether the parties have dramatically
changed (realignment)
3. What can NOMINATE tell
us about polarization?
1.
2.
3.
4.
Whether there are two dimensions or one:
Is the liberal-conservative continuum a
good way to categorize politicians?
How far apart each party’s legislators are
from others in the same party (party unity)
How far apart one party’s legislators are
from the other party’s legislators
(polarization)
Whether the parties have dramatically
changed (realignment)
Video: Plotting scores over
time by Party
4. Further Evidence of Party
Polarization
a.
Party-line votes (previous lecture)
b. Filibusters and Cloture
c. Issue Positions
5. Explaining party
polarization
Politicians becoming more extreme? But
why? Self-defeating to move away from
median voter.
Hypothesis: Party activists have become
more extreme
a.
b.
i.
ii.
Explains uncertainty about mass shift
(would be delayed relative to elite shift)
Also explains elite shift – activists are key
to candidate success and are known to be
more extreme than either the public or
candidates themselves!
Median Voter (M) Beats All
other positions!
5. Explaining party
polarization
Politicians becoming more extreme? But
why? Self-defeating to move away from
median voter.
Hypothesis: Party activists have become
more extreme
a.
b.
i.
ii.
Explains uncertainty about mass shift
(would be delayed relative to elite shift)
Also explains elite shift – activists are key
to candidate success and are known to be
more extreme than either the public or
candidates themselves!
c. Evidence: Activist polarization
d. What polarized activists?
Competing explanations:
Realignment of the South in 1960s/1970s fails
to explain continued polarization in 1990s
Primaries: Internal democracy allowed party
“capture” by activists using primaries (especially
Congressional ones)
Media change: End of “fairness doctrine” and rise
of new media (from talk-radio to the Internet)
allow politically-aware to hear only fellow
ideologues
Political blog polarization
(2010)
Ideologies of website readers
e. Is mass polarization
increasing? Probably.
Abramowitz: More political
engagement more polarization
Consistent with a “trickle out” effect
from party activists to informed voters
But what factors cause increased
polarization? (Abramowitz)
Education will not eliminate
polarization!
Abortion (% Pro-Life)
Evolution
Climate Change (Existence)
Climate Change (Would Be
Bothered)
Facts About Iraq (WMD)
Economic Inequality (Has it
Increased?)
V. A Geographic Divide?
The 2004
“Jesusland” Map:
Red vs. Blue as a
fundamental
religious divide –
or “closely but not
deeply divided?”
A. Voting History
B. General Political Regions
1. West Coast
Stereotype: Wealthy,
elite liberalism.
Reality: Elite liberal
coalition with Latinos
State-Funded Abortion
2. Rocky Mountains
Libertarian
Conservatives: No
Taxes, No Government
Regulation
Seat Belt Laws
3. Great Plains
Religious
Conservatism
But Economic
Populism
4. Great Lakes
In transition from
Blue-Collar
(Economically Liberal,
Socially Conservative)
to
Suburban (Economically
Conservative, Socially
Moderate)
Map of Industrialization –
Great Lakes = Old Industry
5. Northeast
Big-Government
Liberalism: Both
Social and
Economic
c. State Taxes
a. Sex Ed: Cultural Liberalism
in the Northeast
b. Liberal Crime Policy:
Northeast and Victims’ Rights
c. Values: Women’s Age at
First Marriage (Darkest = 27+)
6. The South
States Rights
and Limited
Welfare
but
Big-Government
Conservatism
(Pro-Business)
a. North-South Divide: Origins
b. The “Southern Strategy”
Note difference between Nixon’s 1960 and
1968/1972 positions
Democrats able to attack Nixon on NAACP
membership in South during 1960 campaign
c. The Southern Shift: 1950-1980
Wallace for President 1968
b. The “Southern Strategy”
Note difference between Nixon’s 1960 and
1968/1972 positions
Democrats able to attack Nixon on NAACP
membership in South during 1960 campaign
Note the stop-start nature of the transition:
Ford still writes off the South in 1976…
Moral issues slowly replaced racial issues in
Republicans’ strategy
d. Southern uniqueness today
i. The “Bible Belt” – Moral issues
coincide with racial issues of 1970s
Southern Religious Homogeneity
ii. High poverty, Low welfare
Poverty
Rates
2004:
Darker =
Higher
Rate
% Households Receiving
Cash Welfare
Alabama
Arkansas
Louisiana
West Virginia
Indiana
Texas*
Virginia
Missouri
Florida
Idaho
Mississippi
Illinois
Nebraska *
Kansas
Colorado
Georgia
Maryland
New Jersey
Michigan
Oklahoma
Kentucky
North Carolina
South Carolina
New York
Utah*
New Mexico
New Hampshire
Wyoming
South Dakota(4)
Montana
Pennsylvania
California (1)
Tennessee
Wisconsin
Minnesota
Ohio
Vermont
Washington
Alaska
Maine
Hawaii **
assachusetts **
Rhode Island
$2,500
Medicaid Eligibility by State (2008)
$2,000
$1,500
$1,000
$500
$0
iii. Still lower education
Percent
Completed
High
School or
GED By
Age 25
iv. Hard-line anti-crime policy
(2009)
Example of Southern Uniqueness:
Execution of Juveniles (2004)
7. Summary: Alignments
Exception to
Region
C. How stable and homogenous
are these regions?
1. Economic Issues
a. Anti-Union: “Right to Work”
Union Membership
b. Economic Protection
State Minimum Wage Laws
Parental Leave Policies (A =
Most / F = Least)
State EITC (2008)
c. State Balanced Budget Laws
2. Energy Policy
a. Renewable Energy (RPS)
b. Gasoline tax rates
3. “Moral Issues”
a. Abortion: Legal everywhere but laws differ…
“Partial Birth” Abortion Bans (2007)
Pro-life State Governments
(2011)
Abortion Rates (2010-2011)
Stem Cell Research Support
b. Religion in Schools:
Moment of Silence Laws
State Treatment of Evolution
c. Family Structures
Gay Adoption Banned (Blue) or OK (Orange)
Gay/Lesbian Rights
Scale includes:
same-sex marriage
2nd parent adoption for same-sex
couples
civil unions
health benefits for same-sex partners
job antidiscrimination
hate crimes protection
housing antidiscrimination.
Gay/Lesbian Rights (2009)
SUPPORT
POLICY
Gay Marriage (2012)
st
1
Cousin Marriage
Divorce Rates – indicator of
attitudes toward marriage?
4. Liberty vs. Safety
a. Motorcycle Helmet Laws
b. Crime Policy
Imprisonment Rates
Marijuana Laws
Laws Against Racial Profiling
Gun Tracking
3. Multiculturalism.
“Official English” Laws
D. What underlies the
regional divides?
1. Smaller cultural regions?
2. Patterns of Issue
Salience?
Many regions have multiple loyalties
(opportunities for change or new regional
divides). Possible examples:
Rockies values low taxes over less social
regulation
Great Lakes values economic
performance/policy over social issues
Great Plains values religiosity over economic
populism
VI. Case Study: The Tea
Party Movement
If statistical evidence is inconclusive,
perhaps process-tracing a single case
will provide more insight
A. Is the Tea Party
a Mass Movement?
1. Note: Most mass movements are small,
compared to the general public
2. Tea Party supporters = about one-fourth of
Americans (opinion surveys) mass support
1 in 5 of these (2.5%) has donated money or
protested mass participation
Donors generally vastly outnumber protesters
unclear if mass activism
650 national organizations, fewer than half
“active.” Most of these = 500 members or less
B. How Does the Tea Party
Get Anything Done?
Fragmentation usually reduces influence of
mass movements
Two main groups set the agenda using media
and money:
FreedomWorks (Tea Party Patriots)
“Our Country Deserves Better” PAC (Tea Party
Express)
Other GOP groups often support Tea Party
activities / candidates
C. What Mobilized the Tea
Party?
See exercise (and Abramowitz)
VII. Assessing the
Propositions
1.
2.
Identity: Political identification may be
increasing, but its salience is still low.
BUT: Other issues increasingly correlate with
political views.
50/50 Nation: Americans are closely divided,
but disagreement over depth
BUT: Tea Party suggests elite polarization can
produce mass polarization
VII. Assessing the
Propositions
3.
4.
Polarization: Appears to be increasing, but
could be “sorting” (next lecture on individual
political attitudes)
Geographic Divide: Political regions can be
drawn which match partisan divides
BUT: More regions than red/blue, regions are
not homogenous and seeds of change exist
Assessing the Propositions
5. Geography seems to be a reinforcing
cleavage, but we need additional evidence
on the political significance of race and class
6. Tea Party movement is a mass movement
with aspects of a top-down movement and
other aspects of a decentralized movement,
which has evolved closer alignment with its
sponsors’ priorities

