Presentation
advertisement
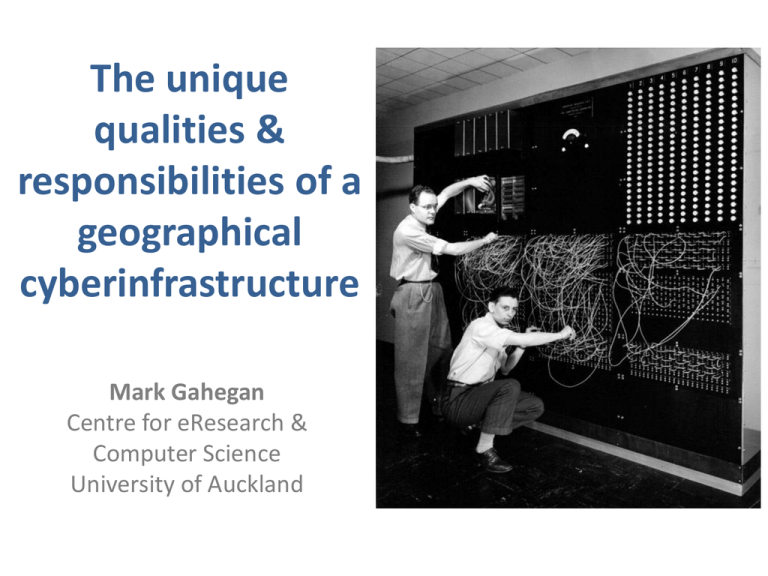
The unique qualities & responsibilities of a geographical cyberinfrastructure Mark Gahegan Centre for eResearch & Computer Science University of Auckland Overview 1. Data-intensive GIScience: from data poor to drowning in 40 years 2. Challenges of organizing Big Data for GIScience 3. Challenges of computing with Big Data for GIScience Data poor to drowning the case of remote sensing Early remote sensing platform 1980s: 30m x 30m pixels 2000s: 2.5 m x 2.5m pixels Airborne Sensor platform (much cheaper and more flexible than satellite) One of the latest unmanned remote sensing platforms How much data so far? • NASA’s Earth Observation System (EOS) program has about 4.2 petabytes (2010) – 430 times larger than the DT-LoC – 3 times smaller than the output from the Large Hadron Collider in a single year • Similar sized collections can be expected in Europe and Asia • EOS contains mostly satellite data…not air photos, map or field data • What about ‘Volunteered’ data? • And “The long tail of dark data…”? How does that compare to other science disciplines? • Large Hadron Collider (Physics) – 10-14TB year – A 20km high stack of DVDs or 400,000 large PC disks • Genomics (Biology) – Imaging sequencers: Data volume doubling every 6 months – Can’t back it up to tape fast enough Big Data Challenges for CI 1. Storing unprecedented volumes of data (and accelerating) – Data production passed storage capacity in 2007 – Cost differential is increasing, Rate of data production is increasing 2. Describing what we have in ways that are helpful to future users (and our future selves) – Metadata and Semantics for describing content (this tends to be producer-focused) – But also use-case metadata and emergent relationships (tends to be consumer-focused) 3. Finding what we need, in the context of our current task – semantically-enabled search engines that can use the above descriptions, (ideally from within analytical tools and workflows) 4. Working out what we do not need to keep – Because it will not be used again or offers no ‘information gain’ – Because it is easier to recreate than to store 5. Governing data collections well, within their communities of use – information and knowledge portals – effective governance of data resources – quality control strategies, including peer review and rewarding excellent contributions The Big Data responsibilities of CyberGIS • Create successful tools and languages to describe and find data, so that reuse is actively encouraged • Enable the analysis, • re-educate to reset the expectations… • The data that we collect forms a natural history of the changing planet on which we live – The same cannot be said for many other sciences... • This ongoing record is more important than the individual research we each engage in – Note we may not anticipate the questions that future researchers may need to answer using our data Emerging data opportunities… What do these four different spatial analysis tasks have in common? • Find traffic bottlenecks…? • Compute earthquake epicenters…? • Track Influenza epidemics…? • Perform land cover classification…? ‘Fourth paradigm’ –science led from Big Data HPC Analysis challenges of massive data in Earth Science Re-express (spatial) analysis algorithms so that they scale across HPC hardware AND Big Data: – Geometry: Point / line / region / volume—algebra, selection, transformation, projection – Topology: connectivity, route-finding, friction – (Spatial) statistics: classification, interpolation – Point pattern analysis / discovery: cluster detection The challenge is to be SYSTEMATIC, not piecemeal What’s limiting the task? • Memory? – 1TB on a single compute node now – 2-8TB on some equipment (e.g. SGI UV) • CPU? – Tightly bound—needs a lot of inter-process communication – Embarrassingly parallel—can be perfectly decomposed • Data? – Random? Linear? Blocky? (Degree of locality of reference) – Replication? • Communications? – Data channels, infiniband, metadata • Nothing? – Not everything needs to be parallelized…just the limiting segments Domain Decomposition Architecture examples Use case Scaling Shared memory: (OpenMP) Usually bound to a single compute node. Requires code rewrite… Increase node core count / memory Distributed memory: (MPI) Scaling beyond the compute node Requires major rewrite Additional MPI fabric used to pass messages between nodes Adaptive: (Cassandra/H adoop/SOG) Data-intensive, evolving, decomposition not fully understood at outset More data bandwidth by adaptively dividing up and replicating the data Massively parallel: (BlueGene / GPU) Very high degree of parallelization and power efficiency Potentially scales to 1,000,000 processors Or to put it another way… • How do GISci algorithms map onto the well understood supercomputing templates – Dense Grids – Sparse Grids – Computational Fluid Dynamics – N-Body interactions – Monte Carlo – Data Intensive – etc... (Are all our algorithms covered by these templates?) Slowdown Cost of reengineering vs. slowdown for GIS algorithms Utility Cost of reengineering Sticky CyberGIS How to attract and keep the community involved? – Outreach & community engagement – Compelling and appealing functionality • • • • Data and method repositories Workflows Semantic interoperability Killer Apps… – Incentives to contribute – Continuity Computational workflows embedded in social media , • Scripts, workflows, simulations, experimental plans statistical models, ... • Repeatable, reproducible, comparable and reusable • Sharing propagates expertise and builds reputation • One can be ‘friends with an experiment’ in a science, social network http://myexperiment.org Semantically translating map data SemDat Web Service: http://semdat.bestgrid.org/semdat/ Killer App example from geosciences: earthquake modelling Seismicity (ANSS) Paleoseismology Local site effects Geologic structure (USArray) Faults (USArray) Rupture dynamics (SAFOD, ANSS, USArray) Seismic Hazard Model InSAR Image of the Hector Mine Earthquake A satellite generated Interferometric Synthetic Radar (InSAR) image of the 1999 Hector Mine earthquake. Stress transfer (InSAR, PBO, SAFOD) (from Leinen, 2004) Shows the displacement field in the direction of radar imaging Each fringe (e.g., from red to red) corresponds to a few centimeters of displacement. Crustal motion (PBO) Crustal deformation (InSAR) Seismic velocity (USArray) GEON: Chaitan Baru, SDSC Conclusions • Big Data creates new ways of approaching GIScience: discovery-led rather than theory-led – Need to scale up our storage – Useful data is the data that can be reused… • Scalable GIScience methods are needed now – Domain decomposition has always been the challenge for GIScience, and is still. – A systematic analysis of algorithm bottlenecks and amenability to parallelization has been missing for 20 years – Such an analysis is an ongoing task…as new parallel HPC and data paradigms become possible – Re-educate to reset expectations among researchers • Use the best technologies and tools from other disciplines who have made this leap, especially bio-informatics, computational chemistry, high energy physics Questions? Fourth paradigm and data complexity 1. 2. 3. 4. Experiment & Measurement Analytical Theory Numerical Simulations Data Intensive Computing Data fusion + data mining + synthesis/learning + explanation http://research.microsoft.com/en-us/collaboration/fourthparadigm/ Utilizing massive data to discover and explain Is not as easy as you might think… – Poor and sparse samples, surrogates, bias… – As number of dimensions increases it becomes increasingly difficult to add in any data point without giving rise to some kind of statistically significant ‘pattern’ or ‘cluster’ – And parametric distributions become unreliable – It is very difficult to discover useful things that are unknown by experts We need to capture the meaning of data, not just the data itself aligning heterogeneous definitions in content, schema Era Eon Period Series GEOLOGIC AGE ROCK TYPE Volcanic STANDARD DEFINITIONS • data content: rock types, time scale, … • data schema from www.GEONgrid.org OneGeology interoperability portal Data from different countries can be integrated, despite using different geologic categories /legends Complete connected neighborhood of a research article or dataset (Alfred knowledge browser)
