imares - Wageningen UR
advertisement
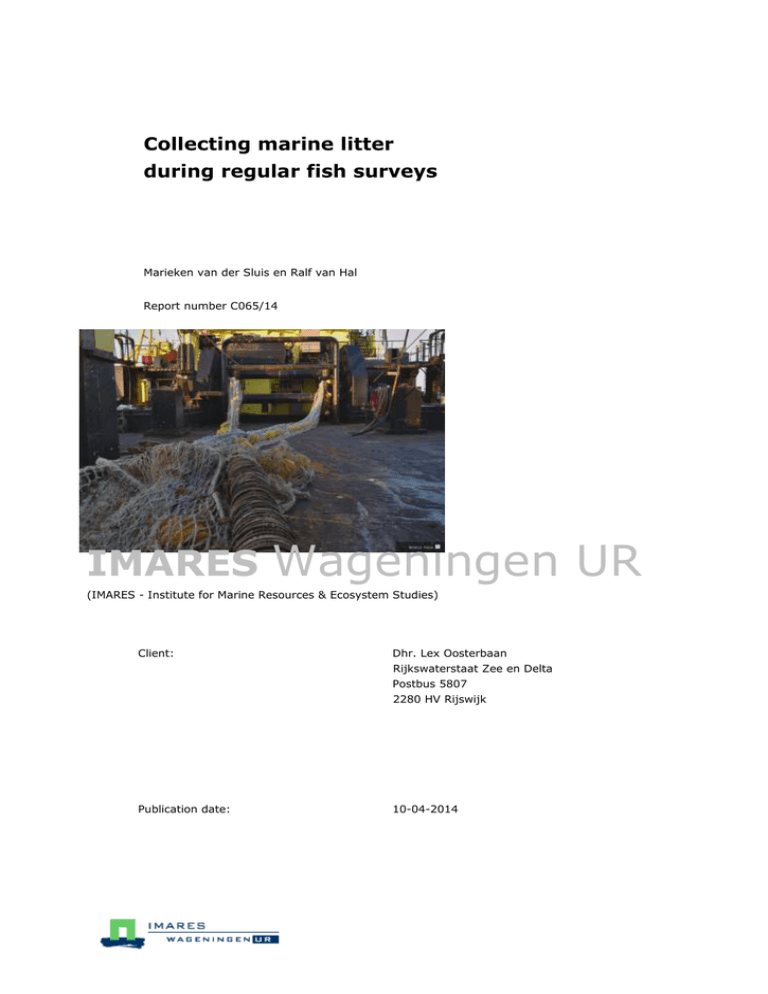
Collecting marine litter during regular fish surveys Marieken van der Sluis en Ralf van Hal Report number C065/14 IMARES Wageningen UR (IMARES - Institute for Marine Resources & Ecosystem Studies) Client: Dhr. Lex Oosterbaan Rijkswaterstaat Zee en Delta Postbus 5807 2280 HV Rijswijk Publication date: 10-04-2014 IMARES is: an independent, objective and authoritative institute that provides knowledge necessary for an integrated sustainable protection, exploitation and spatial use of the sea and coastal zones; an institute that provides knowledge necessary for an integrated sustainable protection, exploitation and spatial use of the sea and coastal zones; a key, proactive player in national and international marine networks (including ICES and EFARO). P.O. Box 68 P.O. Box 77 P.O. Box 57 P.O. Box 167 1970 AB IJmuiden 4400 AB Yerseke 1780 AB Den Helder 1790 AD Den Burg Texel Phone: +31 (0)317 48 09 00 Phone: +31 (0)317 48 09 00 Phone: +31 (0)317 48 09 00 Phone: +31 (0)317 48 09 00 Fax: +31 (0)317 48 73 26 Fax: +31 (0)317 48 73 59 Fax: +31 (0)223 63 06 87 Fax: +31 (0)317 48 73 62 E-Mail: imares@wur.nl E-Mail: imares@wur.nl E-Mail: imares@wur.nl E-Mail: imares@wur.nl www.imares.wur.nl www.imares.wur.nl www.imares.wur.nl www.imares.wur.nl © 2014 IMARES Wageningen UR IMARES, institute of Stichting DLO The Management of IMARES is not responsible for resulting is registered in the Dutch trade damage, as well as for damage resulting from the application of record nr. 09098104, results or research obtained by IMARES, its clients or any claims BTW nr. NL 806511618 related to the application of information found within its research. This report has been made on the request of the client and is wholly the client's property. This report may not be reproduced and/or published partially or in its entirety without the express written consent of the client. A_4_3_2-V13.3 2 of 19 Report number C065/14 Contents Contents................................................................................................................... 3 Summary ................................................................................................................. 4 1. Introduction ..................................................................................................... 5 2. Materials and Methods ....................................................................................... 5 3. Results ............................................................................................................ 8 4. Conclusions.................................................................................................... 17 5. Recommendations........................................................................................... 17 6. Quality Assurance ........................................................................................... 18 7. References ..................................................................................................... 18 9. Justification.................................................................................................... 19 Report number C065/14 3 of 19 Summary The Marine Strategy Framework Directive (MSFD) requires from the European Member States to develop programmes of measures to achieve or maintain Good Environmental Status (GES) in European Seas. To be able to evaluate the state of the marine waters on a regular basis, monitoring plans are established by the Member states. The GES is described by 11 descriptors, and marine litter is one of them. This report presents the results of the marine litter monitoring on the IBTS survey of 2014 and the BTS survey of 2013. Since 2013 marine litter is collected during the International Bottom Trawl Survey (IBTS) and Dutch Beam Trawl Survey (BTS) following a protocol developed by ICES. The composition and the distribution of the sea floor marine litter from the catch is analysed and the results are compared with the results from the IBTS and BTS surveys of last year. The conclusion is that the composition of the litter collected during the different surveys is similar; plastic and specifically plastic sheets are the most dominant litter items found. Regarding the distribution of the litter, the hotspots with raised concentrations differ between BTS en IBTS and surveys in the foregoing year. However, they seem to be concentrated near river mouths and estuaries. 4 of 19 Report number C065/14 1. Introduction Because of the European Marine Strategy Framework Directive (MSFD, 2008/56/EC), the EU Member States are obliged to take measures to achieve or maintain good environmental status (GES) in their marine waters. GES is described by 11 descriptors. One of these, Descriptor 10, is Marine Litter. To achieve GES in 2020 for this descriptor it is necessary that “Properties and quantities of marine litter, including their degradation products such as small plastic particles down to micro-plastics do not cause harm to the coastal and marine environment and their volume decreases over time.” Marine litter can be found throughout the water column, deposited at the seafloor or washed ashore. A pilot study in 2013 (van Hal & de Vries, 2013) showed that it is possible to monitor the litter that is deposited at the seafloor from the catches of existing fish surveys, e.g. International Bottom Trawl Survey (IBTS) and Beam Trawl Survey (BTS). A protocol for collecting data on marine litter was developed by some working groups of the International Council for the Exploration of the Sea (ICES) (e.g. WGISUR, IBTSWG, WKMAL). This protocol was included in the latest manual of the IBTS (The International Bottom Trawl Survey Working Group, 2012). Since 2013 IMARES collects marine litter during the IBTS and BTS surveys, consistent with the method as described in the IBTS manual. In this report the litter data collected during the IBTS survey in January and February 2014 and the BTS survey in August and September 2013 is described and compared with the findings of the surveys in the foregoing year. 2. Materials and Methods 2.1 Regular fish surveys IBTS The IBTS is carried out annually in January and February. The ship that is used for this survey is the Tridens II. The survey is designed such that each ICES rectangle is fished twice. The rectangles are distributed over the countries such that each rectangle is fished by two countries each fishing one haul. The Dutch part of the survey covers the Southern North Sea, the English Channel, the German Bight and a northern part in front of the Scottish coast (figure 1). The gear that is used is the “Grand Ouverture Verticale” (GOV), a (semi-pelagic) bottom trawl. The mesh size of the net is 100 mm and 10 mm in the codend. The headline of the net is about 5 m above the seafloor, which is particularly convenient to fish pelagic species and those species which dwell just above the bottom. As the groundrope of the GOV only touches the bottom, flatfish, benthic organisms and bottom litter might go underneath it. The only parts of the GOV that slightly penetrate the sea-floor are the two doors, on each side of the net one. The pressure against these doors determines the horizontal opening of the net and this varies with depth. Compared to a beam trawl the width of the gear, and related the surface fished is variable. The width between the doors is therefore measured continuously during each haul. The standard fishing practice is a tow duration of 30 minutes, with a fishing speed of 4 knots. Trawling is carried out only during daylight hours. At the end of each haul the net is hoisted on deck, however a part of it is still overboard and stays there. Then the codend is hoisted on deck and emptied. The catch falls directly below deck, where it is transported by a conveyor belt. The catches are subsequently sorted on this belt. Report number C065/14 5 of 19 Figure 1. Planned rectangles in which GOV hauls have to be executed for the Dutch part of the IBTS. BTS The BTS aims to get indices for stock assessments and recruitment estimation. The BTS is carried out annually in August and September. In each ICES rectangle 1-4 hauls are carried out. The gear that is used is an 8 m steel beam trawl. Two different ships are used, the Isis and the Tridens II. In this report only the litter data collected on the Tridens II during the BTS survey 2014 are involved. The locations of the hauls are showed in figure 2. Trawls speed is set at 4 knots over the ground, trawl duration is 30 minutes. The catch falls directly below the deck, where it is transported by a conveyor belt. The catches are subsequently sorted on this belt. 6 of 19 Report number C065/14 Figure 2. Location of the hauls in 2013 for the Tridens II part of the BTS. 2.2 Sampling litter In 2013 a protocol for collecting data on litter was developed by a few ICES working groups. This was implemented in the manual of the IBTS. The manual of the IBTS states that litter has to be collected each haul and recorded as one of the categories (table 1) with an estimate of the size. Both litter that is found in the catch as litter that is stuck in the nets has to be recorded. There is no guidance on how detailed the catch should be sorted. Visual inspection is done on the IBTS as follows: at the end of each haul one crew member goes on deck and inspects the part of the net that is on deck. The litter stuck to or entangled in the net or the ground rope is collected. Separately from this, the visual litter on the conveyor belt is collected. Subsequently the (subsample) bucket that is collected at the end of the conveyor belt is also searched for litter. In this way the catch is inspected twice, except for the largest catches where a part of the catch is transported overboard directly and only a subsample of the buckets is inspected. Report number C065/14 7 of 19 Each litter item is assigned to one of the categories (table 1), weighed (after removing attached organisms and debris) and the size is estimated. When organisms were attached to the litter this is recorded as well. Occasionally an extended description is given of a litter item. Table 1: Classification of marine litter items and the related size categories (The International Bottom Trawl Survey Working Group, 2012). 3. Results The Dutch 2014 IBTS Q1 performed 57 hauls in total. One of these hauls was invalid. In 54 of the valid hauls at least one litter item was found, meaning that only 2 hauls were without marine litter. In total 299 litter items were registered. For he BTS 2013 (Tridens II), 69 hauls were checked for litter. In 63 of the hauls, one or more litter items were found. Composition of the litter As can be seen in figure 3, “plastic” is by far the most frequent category followed by the category “natural products”, concerning the litter found during the IBTS 2014. This is also the case for the IBTS survey of 2013 and the BTS survey, as can be seen in figure 4 and 5. 8 of 19 Report number C065/14 Figure 3. Distribution of the litter items over the different categories in the catches of the IBTS Q1 2014. Figure 4. Distribution of the litter items over the different categories, for the IBTS Q1 2013. Report number C065/14 9 of 19 Figure 5. Distribution of the litter items over the different categories, for the 2013 BTS. 10 of 19 Report number C065/14 For some of the items that were found during the IBTS 2014 and the BTS 2013, a more detailed description is given (table 2.). This gives an idea of the diversity of the litter items. Table 2. Composition of the litter for the catches of the IBTS Q1 2014 and BTS 2013. IBTS Category Number % A Plastic Description Cups, bags, duct tape, tie raps, rope, wrappings, fishing lines 265 88.63% B Sanitary waste 0 0.00% C Metals 6 2.01% D Rubber 5 1.67% E Glass/ Ceramics 0 0.00% F Natural products 18 6.02% 5 1.67% G Miscellaneous and nets Fishing related metal, aluminium Rope, wood BTS Category Number % A Plastic Description Cups, bottles, food wrappings, (duct) tape, fishing lines and 230 73,02% nets, balloon lines, plastic bags, gloves B Sanitary waste 1 0,32% Artificial sponge C Metals 7 2,22% Tins and cans D Rubber 18 5,71% E Glass/ Ceramics 8 2,54% F Natural products 26 8,25% G Miscellaneous Gloves, ring, cable protector Bottles Coal, processed wood, pineapple Shorts, t-shirt, canvas, shoe, shoe sole, paint, formica, video 25 7,94% tape, electric equipment, coffee pads Regarding the IBTS 2014 survey, “sheet” is the most frequent subcategory (figure 6) within the “plastic” category, followed by “synthetic rope” and “fishing line” (monofilament). A similar ranking for the plastic litter is found for the IBTS 2013 survey and the BTS 2013 survey (figure 7 and 8). For last year’s IBTS, “sheet” is also the main subcategory, but the subcategory “fishing line” (monofilament) is more frequent than “synthetic rope”. Report number C065/14 11 of 19 Figure 6. Number of litter items per sub-category of “plastic” in the IBTS Q1 2014. Figure 7. Number of litter items per sub-category of “plastic” for the IBTS survey in 2013. 12 of 19 Report number C065/14 Figure 8. Number of litter items per sub-category of “plastic” for the BTS survey in 2013. Report number C065/14 13 of 19 The mesh size (1 cm IBTS and 4 cm BTS) determines the minimum size that can be caught. As can be seen in figure 9, the majority of the litter items caught are smaller than 25 cm2. Items larger than 1m2 are scarcely found. Probably a large number of litter items on the seafloor or in the water column are even smaller than the litter that is caught during the IBTS and BTS surveys, for example micro-plastics. Other techniques are needed to monitor the small marine litter, for example MIK-larvae sampling, water sampling or a high speed manta-trawl. Figure 9. Size distribution of the litter found during the IBTS 2014. Distribution of the litter In two maps (figure 10 and 11), the number of items per haul per km2 is represented for the IBTS 2014 and IBTS 2013. When comparing the distribution of litter items from last year’s survey with the distribution in the year before, it seems that the “hot spots” are partially the same. Both IBTS surveys (2013 and 2014) show raised concentrations near the estuary of the Western Scheldt and in the Firth of Forth. In the map for the IBTS 2014, raised concentrations show up near the mouth of the Noordzeekanaal and in the Wash estuary. The raised concentrations north of the Wadden Sea, that can be seen in the map of the IBTS 2013, are absent in the map of the IBTS of 2014. The raised concentrations near the mouth of the Thames, that show up in the maps for the IBTS 2013 is also absent in the maps for the recent survey. This hotspot near the mouth of the Thames is also visible in the map for the BTS 2012 (figure 12). What is also noticeable when the results of the IBTS (figure 10 and 11) and BTS (figure 12 and 13) surveys are compared, is that in general the BTS shows higher litter concentrations per km2. Although the hotspots between years and between different surveys don’t match completely, it seems that most hotspots appear near river mouths and estuaries. 14 of 19 Report number C065/14 Figure 10. Concentration of litter items per haul per km2 for the IBTS 2014. Figure 11. Basic kriging map, representing the number of litter items per haul per km2 for the Dutch and French IBTS 2013 (van Hal & de Vries, 2013). Report number C065/14 15 of 19 Figure 12. Concentration of litter items per haul per km2 for the BTS 2013. Figure 13. Basic kriging map, representing the number of litter items per haul per km2 for the BTS 2012 (van Hal & de Vries, 2013). 16 of 19 Report number C065/14 Organisms attached The majority of items were overgrown with at least some organic material. Bryozoa growing on litter were relatively often found. But also litter overgrown with hydrozoa, crabs, dead man’s fingers and starfish are found more than once. 4. Discussion and Conclusions The different surveys show very similar results; plastic, and specifically plastic sheets, are the most dominant litter items found. Some criticism can be levelled at this conclusion. In the pilot study (Van Hal & De Vries, 2013) it is mentioned that the items within category A2 “plastic sheets” vary a lot. This is due to the interpretation of plastic sheet, which is not straightforward. Many items might be named as such, and the categorization is arbitrary. All kinds of wrapping material and various flexible plastic pieces of which the origin is not clear, are included within this subcategory. The subcategory “synthetic rope” also has to be regarded with some caution. It is not always clear if these items are actually caught or if it is part of our own material. The synthetic rope items found during the IBTS of 2013 were mainly small cuttings of netting material very similar to our own net. Repairs of the net are done after almost every haul, resulting in small piece of rope that fall on the deck. These are found when checking the net for litter, but also fall down when the fish is dropped to the lower deck. In microplastic studies, similar self-contamination errors are discussed. Clothing fibres in these studies play a similar role to synthethic rope pieces in this survey. These types of particles therefore need to be treated with great care in data interpretation (Foekema et al., 2013), especially when working sterile is impossible like in trawl surveys. The subcategories A5 and A6 “fishing line” (monofilament and entangled) aren’t straightforward either. Some pieces are clearly entangled, while for other parts it is an arbitrary choice. A5 and A6 could just as well be grouped as it is very likely to be the same source and the question is when it became entangled; When it was lost, later on the seafloor when the current brought it together or in our net. Although the hotspots differ between IBTS en BTS and between years, they seem to be concentrated near river mouths and estuaries. In general, the BTS shows higher values per km2, which can be attributed to the higher bottom impact of the fishing gear that is used. During the hauls of the BTS survey, less debris can go underneath the gear. However, the GOV is likely to have a higher catchability for litter floating near the bottom. And the mesh size of the BTS is also larger, so that less of the smaller litter is caught. 5. Recommendations International manual and cooperation: Extend the manual of the IBTS on sampling marine litter. o The accuracy of searching the catch. o The accuracy of searching the net. o Revising litter categories. Make first steps in calculating a North Sea index, based on the last years international data. IMARES actions: Improve the registration system on board, by making the import program ready for litter information. Investigate possibilities to extend monitoring litter to the surveys on the Isis or other regular survey programs. Create possibilities to store the data in the IMARES database. Create an upload of this data to the ICES DOME database. Report number C065/14 17 of 19 National actions: Continue monitoring of litter at least on the IBTS and BTS on board of the Tridens. o Make it an official yearly monitoring program (stand alone or as part of the upcoming MSFD monitoring requirements (potentially included in the DCF, WOT program) Extend the current survey program intensifying monitoring for litter in expected hotspots. 6. Quality Assurance IMARES utilises an ISO 9001:2008 certified quality management system (certificate number: 1242962012-AQ-NLD-RvA). This certificate is valid until 15 December 2015. The organisation has been certified since 27 February 2001. The certification was issued by DNV Certification B.V. Furthermore, the chemical laboratory of the Fish Division has NEN-EN-ISO/IEC 17025:2005 accreditation for test laboratories with number L097. This accreditation is valid until 1th of April 2017 and was first issued on 27 March 1997. Accreditation was granted by the Council for Accreditation. 7. References Foekema, E.M.; Gruijter, C. de; Mergia, M.T.; Franeker, J.A. van; Murk, A.J.; Koelmans, A.A., 2013. Plastic in North Sea Fish. Environmental Science and Technology 47 (15). - p. 8818 - 8824 Hal, R. van; Vries, M. de; 2013. Pilot:"collecting Marine ligtter during regular fish surveys” Ijmuiden. IMARES Wageningen UR, (Report / IMARES C112/13) - p30 MSFD, 2008. Directive 2008/56/EC of the European Parliament and the Council of 17 June 2008 Establishing a Framework for Community Action in the Field of Marine Environmental Policy (Marine Strategy Framework Directive). http://ec.europa.eu/environment/water/marine/index_en.htm The International Bottom Trawl Survey Working Group. 2012. Manual for the International Bottom Trawl Surveys Revision VIII. SISP 1-IBTS VIII. 18 of 19 Report number C065/14 Justification Report number: C065/14 Project Number: 4302507101 The scientific quality of this report has been peer reviewed by the a colleague scientist and the head of the department of IMARES. Approved: Msc. A.J. Paijmans Researcher Signature: Date: april 10th 2014 Approved: Drs. J.H.M. Schobben report Head of department Fish Signature: Date: Report number C065/14 april 10th 2014 19 of 19
