Chapter 2: Population
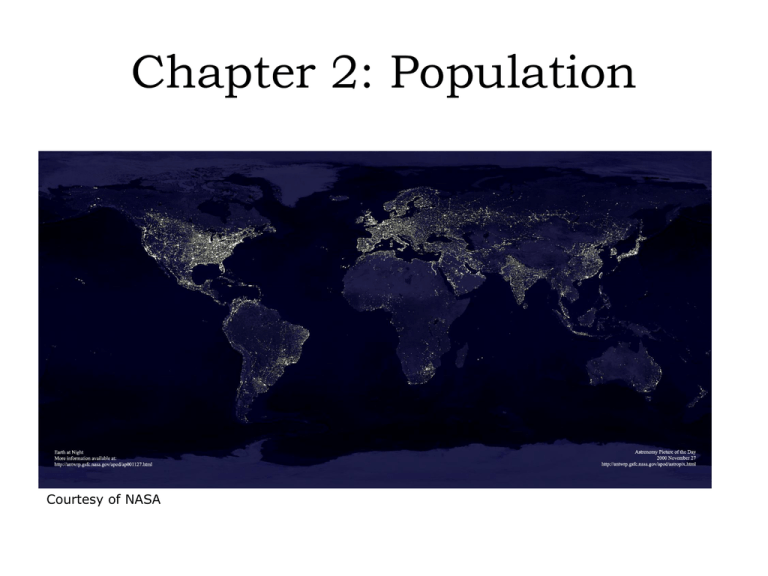
Courtesy of NASA
Where in the World People Live
and Why
• Population density: a country’s total
population relative to land size
• Assumes an even distribution of
population to the land
© H.J. de Blij, P.O. Muller, and John Wiley & Sons
Where in the World People Live
and Why
Physiologic Population Density
• The number of people per unit area of
agriculturally productive land
Concept Caching:
Rice Terraces- Bail, Indonesia
© Matt Ebnier
Field Note: Luxor, Egypt
© Alexander B. Murphy
Moving away from the river a few blocks, the
land becomes sandy and wind-sculpted.
© Alexander B. Murphy
Egypt’s arable lands are along the Nile River Valley.
“The contrasting character of the Egyptian landscape could not be more striking. Along the Nile
River, the landscape is one of green fields, scattered trees, and modest houses, as along this
stretch of the river’s west bank near Luxor. But anytime I wander away from the river, brown,
wind-sculpted sand dominates the scene as far as the eye can see. Where people live and what
they do is not just a product of culture; it is shaped by the physical environment as well.”
Where in the World People Live
and Why
Population Distribution
• Descriptions of Earth’s surface
locations where individuals or groups
(depending on the scale) live.
• Population distributions commonly
visualized as dot maps [1 dot
represents a certain number of a
population]. Ex. 1:100,000 people
World Population Distribution
© H.J. de Blij, P.O. Muller, and John Wiley & Sons
As we discussed in the field note at the beginning of this chapter,
the populations of China and India account for 40 percent of the
world currently, and India is predicted to outpace China’s
population in the 2030s. How will Figure 2.5 look different 50 years
from now? If you were updating this textbook in 50 years, where
would the largest population clusters in the world be?
© H.J. de Blij, P.O. Muller, and John Wiley & Sons
Where in the World People Live
and Why
Reliability of Population Data
• Census: Federal government funding
depends on population data.
• Political implications of underrepresentation of populations.
• United Nations, World Bank, and
Population Reference Bureau collect data
on world populations.
– Ex. USA Annual Census.
Data from: US Census Bureau
East Asia
• Almost 25% of world’s population
• Population concentrated in Korea,
Japan, China
• Over 1.3 billion people in China
Largest human populations on Earth!
South Asia
• Physical geography barriers separate
population clusters
– Himalaya Mountains; Indus River Valley
– Confined region with rapidly growing
population
• Bangladesh: 152 million people in an area
the size of Iowa
– Natural hazards affect populations unequally
– Ex. Hurricanes/floods
North America
• Megalopolis
Huge urban agglomerations; Boston,
NYC, Philadelphia, Baltimore,
Washington, D.C
This accounts for more than 20% of US
population!
What region of country?
Population: Rise and Fall
(Global Place Perspective)
• Thomas Malthus: An Essay on the
Principles of Population (British
economist; 1798)
– Grows faster than food supply; food
grows linearly, population grows
exponentially; population crash expected.
• Births – Deaths = Natural Increase
Does not factor immigration (inmigration) or emigration (outmigration)
into the equation
Population Growth: World,
Regional, National Scales
• Crude Birth Rate (CBR)
Number of births in a year per 1000
• Crude Death Rate (CDR)
Number of deaths in a year per 1000
• Total Fertility Rate (TFR)
Average number of children born to a woman of
childbearing age
Future Population Growth
• Stationary Population
Level (SPL) –
– The level at which a
national population
ceases to grow
– Anticipated dates for
population stabilization
are often moved back
• Ex. India – major growth.
Demographic Transition
• Factors limiting population growth:
Famine, epidemics, plagues, wars
• Factors enhancing population growth:
Agricultural advances, Industrial Revolution,
sanitation, vaccinations
Population Composition:
Why it Matters
• Population composition: structure of a
population in terms of age, sex, marital
status, education and other properties.
• Age and sex = key indicators
• Demographers use population pyramids to
represent traits.
• Young vs. elderly in any population will
determine social needs.
• Geographers study spatial distribution and
population composition.
Figure 2.16
Age–Sex Population Pyramids for
Countries with High Population
Growth Rates.
Countries with high total fertility
rates, high infant mortality rates
and low life expectancies will have
population pyramids with wide
bases and narrow tops.
Data from: UN, World Population Prospects
Figure 2.17
Age–Sex Population Pyramids
for Countries with Low
Population Growth Rates.
Countries with lower total fertility
rates and longer life expectancies
have population pyramids shaped
more uniformly throughout.
Data from: UN, World Population Prospects
Geographies of Health:
Influence on Population
Dynamics
• Global Life
Expectancy =
• Infant/Child
Mortality –
Africa/S.
Asia highest
Study Figure 2.19, the infant
mortality rate (IMR) by state in the
United States. Hypothesize why
the IMR is low in some regions of
the country and high in others.
Shift scales in your mind, and
take one state and choose one
state to consider: how do you
think IMR varies within this
state?
What other factors are involved at
this scale and this level of
generalization to explain the
pattern of IMRs? Use the
population Internet sites listed at
the end of this chapter to
determine whether your
hypotheses are correct.
Data from Centers for Disease Control
Influence on Health and Well-Being
• Health closely related to location and
environment.
• Disease outbreak - source and diffusion are
studied, locational analysis to predict
diffusion and prevent.
• Endemic vs.
Pandemic.
Infectious Diseases
• 65% of all diseases are infectious
• Malaria – Vectored = indirect contact
with host. [mosquitos to human]
– 300 million people infected today
– Tropics, high death and disability rate
• HIV/AIDS- Nonvectored = direct
contact with host. [human to human]
– Major effect in short time (25 years)
Field Note:
Johannesburg, South Africa
“The day was so beautiful and the
children’s faces so expressive I could
hardly believe I was visiting an AIDS
hospice village set up for children. The
Sparrow Rainbow Village on the edges
of Johannesburg, South Africa, is the
product of an internationally funded
effort
to
provide
children
with
HIV/AIDS the opportunity to spend
what time they have in a clean, safe
environment. Playing with the children
brought home the fragility of human life
and the extraordinary impacts of a
modern plague that has spread
relentlessly across significant parts of
Subsaharan Africa.”
© Alexander B. Murphy
Concept Caching:
Stop AIDS
© Barbara Weightman
Chronic and Genetic Diseases
• Degenerative diseases afflict mostly
middle/old age populations.
USA Example • 100 years ago: Tuberculosis,
pneumonia, and heart diseases.
• Today: Cancer, heart disease, stroke
and accidents leading causes of death.
Population and
Government Influence
• Expansive population policies:
Encourage large families and raise the
rate of natural increase
• Eugenic population policies:
Designed to favor one racial or cultural
sector of the population over others
Population and Government
(cont’d)
• Restrictive
population policies
© H.J. de Blij
Chengdu, China
e.g., One-Child Policy
in China (1970s)
– Limitations: Sweden
family-friendly (1980s)
– Contradictions:
Roman Catholic
doctrine (birth control
and abortion stats)
China’s Changing Population
Data from: Population Reference Bureau
Homework
Read textbook ch.2
Video (Continue)
Homework: Choose one “Thinking
Geographically” topic in Ch.2 textbook
and answer (1 page).


