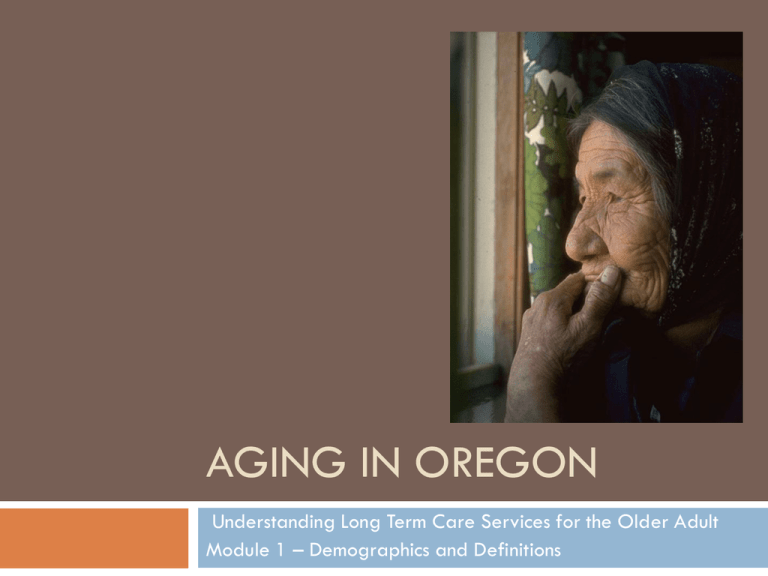
AGING IN OREGON
Understanding Long Term Care Services for the Older Adult
Module 1 – Demographics and Definitions
Some National Demographics
The older population, persons 65 years or older,
numbered 39.6 million in 2009 (the latest year for which
data is available).
They represented 12.9% of the U.S. population, about
one in every eight Americans.
By 2030, there will be about 72.1 million older persons,
more than twice their number in 2000.
People 65+ represented 12.4% of the population in the
year 2000 but are expected to grow to be 19% of the
population by 2030.
Over one in every eight, or 12.8%, of the population is
an older American.
National Demographics (cont.)
Persons reaching age 65 have an average life
expectancy of an additional 18.6 years (19.8 years for
females and 17.1 years for males).
Older women outnumber older men at 22.4 million
older women to 16.5 million older men.
Older men were much more likely to be married than
older women--72% of men vs. 42% of women (Figure 2).
42% older women in 2002 were widows.
About 31% (11.2 million) of non-institutionalized older
persons live alone (8.3 million women, 2.9 million men).
National Demographics (cont.)
Half of older women (50%) age 75+ live alone.
The population 65 and over will increase from 35 million
in 2000 to 40 million in 2010 (a 15% increase) and then
to 55 million in 2020 (a 36% increase for that decade).
The 85+ population is projected to increase from 4.2
million in 2000 to 5.7 million in 2010 (a 36% increase)
and then to 6.6 million in 2020 (a 15% increase for that
decade).
http://www.aoa.gov/AoARoot/Aging_Statistics/Profile/index.aspx
(Sources: Projections for 2010 through 2050 are from: Table 12. Projections of the Population by Age and Sex for the United States:
2010 to 2050 (NP2008-T12), Population Division, U.S. Census Bureau; Release Date: August 14, 2008. The source of the data for
1900 to 2000 is Table 5. Population by Age and Sex for the United States: 1900 to 2000, Part A. Number, Hobbs, Frank and Nicole
Stoops, U.S. Census Bureau, Census 2000 Special Reports, Series CENSR-4, Demographic Trends in the 20th Century. The figures for
2007 are from the Census Bureau 2007 population estimates. )
Living Arrangements of Persons 65+, 2009
(Based on data from U.S. Bureau of the Census including the 2008 Current Population Survey, Annual Social and Economic Supplement and the
2008 American Community Survey. See: March 2009 Current Population Survey Internet releases, Detailed Tables and unpublished data from the
2007 Medicare Current Beneficiaries Survey.)
http://www.aoa.gov/AoARoot/Aging_Statistics/Profile/2009/6.aspx
Indicator 5 – Living Arrangements
The emerging older adult population
boom in Oregon…..
The first members of the baby boom generation—those
born between 1946 and1964—began turning 60 years
old in 2006 and this population will increase rapidly
during the next several decades.
Between 2010 and 2015, Oregon’s 60+ population is
predicted to increase by almost 140,000.
By 2020, one in five Oregonians will be 60 years and
older and projections indicate that one in four residents
will be 60 years and older by 2030.
More….
Oregonians 85 years or older make up a small but
rapidly growing group.
In 2010, 76,000 individuals will be 85 and older, and
by 2030, nearly 120,000 will be 85 or older, a 57
percent increase.
About 25 percent of older Oregonians need help with
activities of daily living, either from family members or
paid caregivers, and among this group, 20 percent
need help with four or more activities of daily living.
Why should we, as nurses and nursing
students, be interested in older adults?
Oregon’s population of older adults will increase
dramatically over the next five years and thereafter,
which means that the number of older adults with
chronic conditions (such as arthritis, heart disease,
diabetes, depression, and stroke) will also rise.
Arthritis, high blood pressure, and high cholesterol each
afflict approximately 50 percent of people 60 to 74
years old, and percentages for the first two conditions
increase for those 75 years and older.
More…
Less than 50 percent of people 75 years and older meet
recommended requirements for physical activity, and this
cohort is hospitalized for falls at almost five times the
rate of those 60 to 74 years old.
Behavioral Risk Factor Surveillance System (BRFSS) data
reveal that almost 75 percent of Oregonians 60-74
years old do not eat the recommended five servings of
fruits and vegetables per day and only 30 percent have
a healthy body mass index.
What can we do?
A growing body of scientific evidence attests to the efficacy of
primary and secondary prevention measures.
Regular physical activity decreases the risk of developing chronic
conditions such as high blood pressure and diabetes, guards against
weight gain, prevents falls, and enhances emotional well-being.
The benefits to both physical and emotional health from eating a
balanced diet and remaining engaged in community life as one
ages have been documented extensively.
Screening for disease and educating older adults about managing
chronic conditions are crucial to maintaining health and vitality.
Oregon data from: http://www.oregon.gov/DHS/spwpd/sua/docs/state-plan-2009-13.pdf
Aging in America
To learn more about aging in America, watch this
youtube called “The Many Faces of Aging in
America” from the National Council on Aging.
In these two (one, two) youtube presentations, clips
from agewave.com, Ken Dychtwald PhD, shares his
perspective on aging.
What is Long Term Care
Long-term care is a variety of services and supports to
meet health or personal care needs over an extended
period of time. Most long-term care is non-skilled
personal care assistance, such as help performing
everyday Activities of Daily Living (ADLs) – bathing,
dressing, using the toilet, transferring, incontinence care,
and eating.
The goal of long-term care services is to the person
maximize and/or maintain independence and
functioning, and also to provide support at end of
life.
Who Might Need Long Term Care?
Long-term care is needed when a person has a chronic illness
or disability that requires assistance with Activities of Daily
Living. The illness or disability could include a problem with
memory loss, confusion, or cognitive impairment.
This year, about 9 million Americans over the age of 65 will
need long-term care services. By 2020, that number will
increase to 12 million. While most people who need longterm care are age 65 or older, a person can need longterm care services at any age. Forty (40) percent of people
currently receiving long-term care are adults 18 to 64 years
old.
What are the Risks of Needing
Long Term Care?
About 70 percent of individuals over age 65 will require
at least some type of long-term care services during their
lifetime.
Over 40 percent will need care in a care setting for some
period of time. Factors that increase the risk of needing
long-term care are:
Age - The risk generally increases as one gets older.
Marital Status - Single people are more likely to need care from
a paid provider.
Gender - Women are at a higher risk than men, primarily
because they tend to live longer.
Lifestyle - Poor diet and exercise habits can increase the risk.
Health and Family History - also impact the risk.
How much care might one need?
It is difficult to predict how much or what type of care any
one person might need. On average, someone age 65
today will need some long-term care services for three
years.
Service and support needs vary from one person to the next
and often change over time. Women need care for longer
(on average 3.7 years) than do men (on average 2.2
years). While about one-third of today's 65-year-olds
may never need long-term care services, 20 percent of
them will need care for more than five years.
Long Term Care Services
Long term care services may include:
Care or assistance with activities of daily living in the
home from an unpaid caregiver who can be a family
member or friend (unpaid or paid);
Services at the home from a nurse, home health/home
care aide, therapist, or homemaker;
Care in the community; and/or
Care in any of a variety of long-term facilities.
How do care needs change over time?
Many people who need long-term care develop the
need for care gradually. They may begin needing
care only a few times a week or one or two times a
day, for example, help with bathing or dressing.
Care needs often progress as one ages or as a
chronic illness or disability become more debilitating,
causing the person to need care on a more continual
basis.
http://www.longtermcare.gov/LTC/Main_Site/Understanding_Long_Ter
m_Care/Basics/Basics.aspx
In their own words…
Watch and listen to nurses share their thoughts on working with an older
population, describe how they got started working in long term care, and
why they do it.
Please note: Allowing the YouTube clips to fully load in your browser window may result in better video
quality.
Polly Youngren, RN, MN talks about her connection with elders.
Brad Finley, RN talks about the path that led him to working in long term care.
Hannah Perry, BSN, RN talks about discovering long term care after nursing school.
Joan Morris, RN a nurse since 1992, talks about changes in the long term care field
that she has seen.
Beth Jackson, RN talks about starting her position as Assisted Living Director after
two decades of nursing.
Leslie Joy Boyer, RN talks about how her career in health care prepared her for
long term care.


