An Overview of TV Audience Research
advertisement
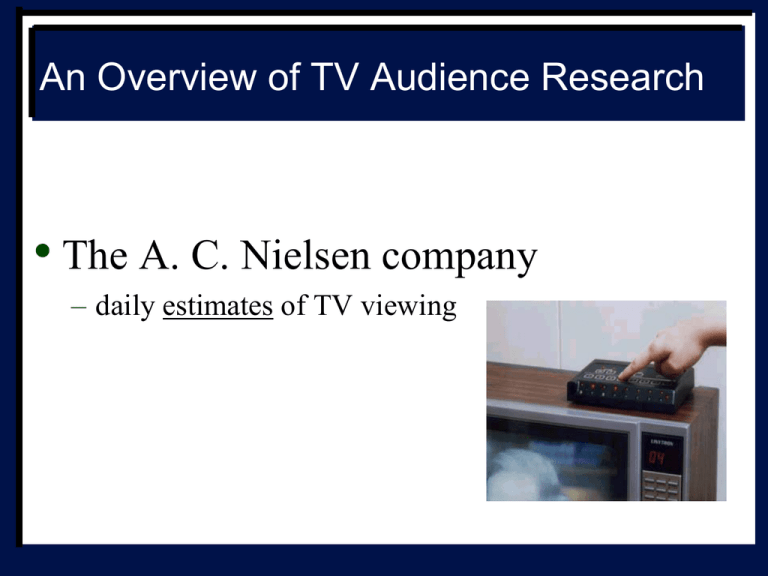
An Overview of TV Audience Research • The A. C. Nielsen company – daily estimates of TV viewing Research terms sampling s diaries People Meter DMA’s (markets) Sweeps months: February, May, July, November Research terms universe s HUT rating share demographics Rating: a show’s % of a maximum potential audience Rating = a % of a universe, including non-viewers Share: a show’s % of those viewing TV Wednesday 9PM AMERICAN IDOL CRIMINAL MINDS 21% NBC NEWS SPECIAL 37% GOSSIP GIRL 11% PRIVATE PRACTICE 3%2% 9% 11% TELENOVELA 6% EVENING WITH QUINCY JONES ALL CABLE Share Does NOT include those with the TV off Demographics = audience composition Adults 18-49 shares Ages AMERICAN IDOL NBC NEWS SPECIAL 3% 27% 35% PRIVATE PRACTICE CRIMINAL MINDS Gender 5% 3% 8% 7% 12% GOSSIP GIRL SP: QUINCY ALL CABLE TELENOVELA Income 3.1/9 means a 3.1 rating with a 9 share … within a specified demographic Evaluate ratings/shares in context Lead-in? Competition? Timeslot history Last week? Last year? Ignore the household rating -Focus on the demographics ! Nielsen now includes … Viewership of commercials DVR Viewing Live, same day playback, next day, and within 2, 3, and 7 days Key trend of recent decades Audience Fragmentation Research / feedback can also include • Focus groups • Surveys • Marketing research • Cable, online and theater testing • Viewer/listener correspondence tabulation
