Facts & Figures VidaNova
advertisement

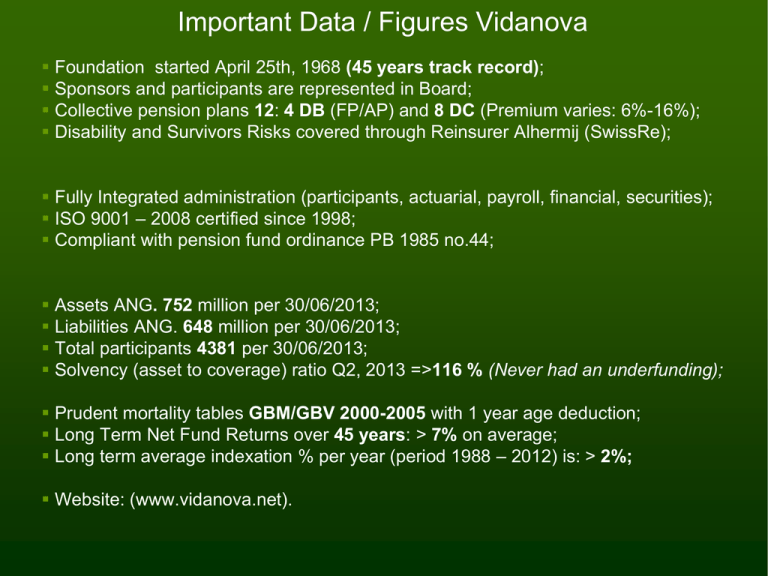
Important Data / Figures Vidanova Foundation started April 25th, 1968 (45 years track record); Sponsors and participants are represented in Board; Collective pension plans 12: 4 DB (FP/AP) and 8 DC (Premium varies: 6%-16%); Disability and Survivors Risks covered through Reinsurer Alhermij (SwissRe); Fully Integrated administration (participants, actuarial, payroll, financial, securities); ISO 9001 – 2008 certified since 1998; Compliant with pension fund ordinance PB 1985 no.44; Assets ANG. 752 million per 30/06/2013; Liabilities ANG. 648 million per 30/06/2013; Total participants 4381 per 30/06/2013; Solvency (asset to coverage) ratio Q2, 2013 =>116 % (Never had an underfunding); Prudent mortality tables GBM/GBV 2000-2005 with 1 year age deduction; Long Term Net Fund Returns over 45 years: > 7% on average; Long term average indexation % per year (period 1988 – 2012) is: > 2%; Website: (www.vidanova.net). MISSION To become the preferred private collective pension provider in the Dutch Speaking Caribbean VISION and GOALS: Committed with its clients. Clients’ pension interest forms an optimal basis for transparent and quality service Realize consistent and managed growth while guaranteeing efficiency Form strategic alliances that add value with commercial institutions and institutional investors CORE VALUES: Professional and Meticulous Accessible and Involved Motivated and Innovative Efficient and Result oriented Independent and Transparent Client and Service Driven Current Governance Structure 2002 - 2013 Sponsors Participants Governance Structure Supervisory Authority CBCS VIDANOVA PENSION FUND FOUNDATION External Accountant PWC Board of Supervisory Directors Board of Managing Directors Vidanova Pension Management Foundation Operations External Actuary Milliman Advisors: LCG Associates AIC International Corporate Financial Solutions ICTAS BNY Mellon Spotlight / Stradius The Galan Group Pension Fund Governance Development 1. Governing body 5 (12. Redress) 2. Identification of responsibilities 4 3 11. Auditor 3. Delegation and expert advice 2 1 10. Accountability 4. Custodian 0 9. Actuary 5. Suitability 8. Disclosure 6. Risk-based internal control 7. Reporting 2003 2005 2010 VIDANOVA Pension Management Executive Director Advisors Financial / Investments / Legal / ICT Manager Business Unit Pensions Coordinator Pensions & Payroll Collaborator / Advisor Pensions Manager Business Unit Finance Coordinator Finance Receptionist / Archive Collaborator Collaborator Finance & Payroll QUALITY IMPROVEMENTS Quality and electronic process handbook Disability and Survivors Risks (DB plans stop loss) DC plans reinsured at Elips ISO 9001 certification since 1998 Yearly client satisfaction surveys with average high satisfaction score (above norm) Pension Fund Governance Compliance Scans level 4,3 reached in 2010 Flexibilization of pension plans (parametric changes) at contract level Annual Financial and Actuarial Reports delivered in 3 months with unqualified opinions All policy papers are updated annually Competencies VPM Personnel are constantly improved Calculation models for DB and DC plans developed 12 different DB and DC pension plans available for clients VPV, Reserve calculations and Annual Reports are produced internally Applications Lifetime, Altair, Exact, AFAS, BPM one implemented and up to par Mutations through WEB portal, downtime ICT low Business Continuity Plan / IT performance scans complies with CBCS regulations Sponsor and Participant Interface and Pension planner are available for clients VPM holds regularly presentations to sponsors and participants at no cost to clients ICT Infrastructure / Web Connectivity Databases: wi Pensions re les s Payroll General Ledger Sponsor Document Management es re l wi Offside backups E Commerce Park Investments s Lease lines Sponsor Satisfied Client Core applications: Lifetime, Exact Globe, Altair, AFAS, BPM - One, Microsoft Office, Database Oracle and SQL ISO 9001 – 2008 Certificate Vidanova Policies in place • 5 year Business Plans • 5 year budget with performance indicators • Quality Handbook & Process descriptions • Code of Conduct • ABTN (actuarial business plan) • Pension Fund Governance policy and scan • Asset Liability Management Studies • Risk Assessment Paper • Investment Policy (local & international) • Asset Allocation Studies • ICT Information Plan • Communication Plan • Quality Management System Note: All policy documents are updated on a regular basis RBC Royal Bank Commercial Banking ASKA Insurance NV Investment Manager/ Fund Centrale Hypotheek Bank Custodian BNY Mellon LCG Associates Global Investment Advisors Real Estate KFRE Joint ventures Pension Funds IFS VIDANOVA VIDANOVA’S STRATEGIC PARTNERSHIPS Project Development VIDANOVA Participants Development 1968 - 2012 Participants per category at the start of the fund in 1968: Participants per Category December 31, 2012 Actives Participants with deferred rights Pensioners Participants with disability pension Widows and orphans Junior participants Total Actives Participants with Deferred Rights Pensioners Participants with Disability Pension Widows and Orphans BNP 267 6 29 3 15 101 421 Total 2,493 637 564 18 201 15 3913 Participants Growth 2013 4381 participants 2807 active 629 deferred 945 pensioners Up to 2nd quarter 2013 137,2% 1997 1968 421 Participants 1846 Participants Growth 1997 – 2013 Average 8,6% Participants Development 4,800 4,200 3,600 3,000 2,400 1,800 1,200 600 0 97 98 99 00 Actives 01 02 03 04 05 Deferred rights 06 07 08 09 10 Pension recipients 11 12 13 Sponsors & Pension Plans 60 50 40 30 20 10 0 97 98 99 00 01 02 Sponsors 03 04 05 06 07 08 Pens. Arrangements 09 10 11 12 13 Premium Contributions 35,000,000 30,000,000 25,000,000 20,000,000 15,000,000 10,000,000 5,000,000 0 97 98 99 00 01 02 03 04 05 06 07 08 09 10 11 P… 12 13 Balance Sheet Development 1968 - 2012 Debit Fixed Properties Mortgages Securities Loans Cash at banks Interest Current Account ElecCoCuracao Other debtors Total 1,214 0.04 0.58 2.99 0.019 0.014 0.0017 0.0004 4.855 Assets Credit Premium Reserves Disability Reserves Current account OGEM 4.366 0.103 0.386 Total 4.855 Liabilities Fixed assets Investments Receivables Liquid assets 2.713 656,327 10,896 53,905 Total Fund Assets 723,842 Fund Capital Reserves Provision DB plans Provision DC plans Other liabilities Minority interest KFR Loans KFR Total Capital and Liabilities 0.1 89.168 598.273 26.125 2.138 3.954 4.084 723,842 Assets Growth Vidanova 235,8% 1997 1968 4,8 million 223,9 million In ANG.219.1 million Growth 1997 - 2013 In ANG.528,1 million Average growth PY: 14,74 % 2013 752,1 million Pension Assets and Liabilities Asset to Liability Ratio 134% 126% 118% 110% 102% 94% 86% 79% 71% 63% 55% 47% 39% 31% 24% 16% 8% 0% ‘97 ‘98 ‘99 ‘00 ‘01 ‘02 ‘03 ‘04 Funding Ratio ;05 ‘06 ‘07 ‘08 ‘09 Minimum ratio ‘10 11 12 13 Invested Assets (Local and International) 800 700 600 500 400 300 200 100 0 1998 1999 2000 2001 2002 2003 2004 Local 2005 2006 2007 International 2008 2009 2010 2011 2012 2013 Investment Review for Vidanova AssetAllocation – Combined Portfolio Target June 30, 2013 U.S. Equity 10.0% U.S. Equity 8.6% Non-U.S. Equity 15.7% Non-U.S. Equity 15.0% Local Portfolio 50.0% Fixed Income 12.1% Local Portfolio 50.4% Other Fixed Income 4.4% Fixed Income 20.0% Real Estate 2.5% Absolute Return 2.5% Cash & Equivalents 4.5% Real Estate 0.6% Absolute Return Asset 1.9% Allocation 1.8% INDEXATION 1988 - 2013 LT Average indexation 2,4% Indexation Example Vidanova Year Pension PM Index % After 1988 1,000 1989 5.00 1990 4.00 1991 5.00 1992 1.70 1993 1.90 1994 2.50 1995 1.70 1996 10.00 1997 3.50 1998 3.00 1999 2.00 2000 3.75 2001 2002 2003 1.33 2004 2.37 2005 2.27 2006 1.58 2007 2.87 2008 2009 0.91 2010 1.70 2011 2012 2013 1.40 Increase 77.30 Index 1,050 1,092 1,147 1,166 1,188 1,218 1,239 1,363 1,410 1,453 1,482 1,537 1,537 1,537 1,558 1,594 1,631 1,656 1,704 1,704 1,719 1,749 1,749 1,749 1,773 773 Development AOV Married Couples AOV uitkering Gehuwd 2000 1800 1600 1400 1200 1000 800 600 400 200 0 AOV uitkering Gehuwd LONG TERM AVERAGE INDEXATION per year 1968 - 2013 Premium & Pension Prognosis 2010 - 2026 50000000 45000000 40000000 35000000 30000000 25000000 20000000 15000000 10000000 5000000 0 LOP in ANG Premium How Vidanova adds value? 1. 2. 3. 4. By distributing all net fund returns to clients; By improving pension arrangements as we grow stronger; Through its indexation policy for actives / non actives; By continuously focusing on improving efficiency defined as cost as % of total cost and our service (timely and accurate); 5. Through favorable reinsurance contracts for risk coverage; 6. Through strategic alliances with commercial partners; 7. By providing an Employers and Participants Interface and a pension planner; 8. By investing in the local economies which help create jobs and stimulates economic growth; 9. Through participation of sponsors and participants in the funds board; 10.By providing timely and accurate pension statements and transparent reporting of the funds performance to all stakeholders.


