Tool - Issue Prioritisation Matrix
advertisement
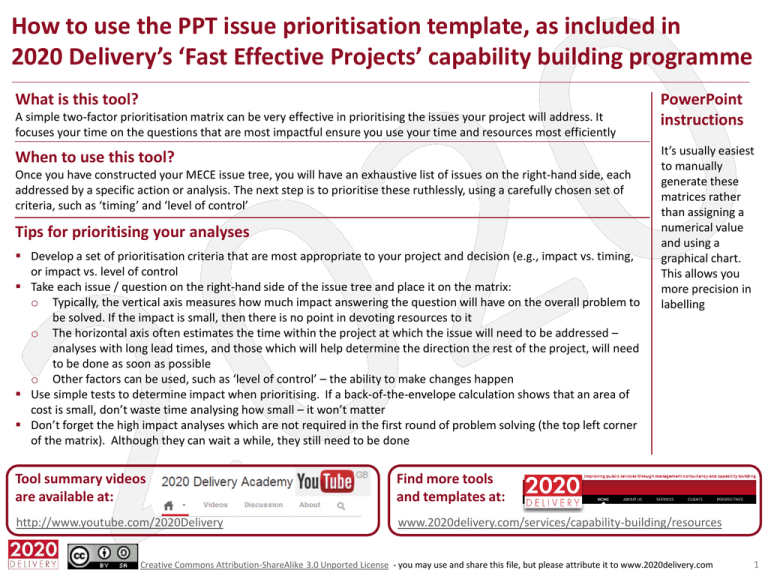
How to use the PPT issue prioritisation template, as included in 2020 Delivery’s ‘Fast Effective Projects’ capability building programme What is this tool? A simple two-factor prioritisation matrix can be very effective in prioritising the issues your project will address. It focuses your time on the questions that are most impactful ensure you use your time and resources most efficiently When to use this tool? Once you have constructed your MECE issue tree, you will have an exhaustive list of issues on the right-hand side, each addressed by a specific action or analysis. The next step is to prioritise these ruthlessly, using a carefully chosen set of criteria, such as ‘timing’ and ‘level of control’ Tips for prioritising your analyses Develop a set of prioritisation criteria that are most appropriate to your project and decision (e.g., impact vs. timing, or impact vs. level of control Take each issue / question on the right-hand side of the issue tree and place it on the matrix: o Typically, the vertical axis measures how much impact answering the question will have on the overall problem to be solved. If the impact is small, then there is no point in devoting resources to it o The horizontal axis often estimates the time within the project at which the issue will need to be addressed – analyses with long lead times, and those which will help determine the direction the rest of the project, will need to be done as soon as possible o Other factors can be used, such as ‘level of control’ – the ability to make changes happen Use simple tests to determine impact when prioritising. If a back-of-the-envelope calculation shows that an area of cost is small, don’t waste time analysing how small – it won’t matter Don’t forget the high impact analyses which are not required in the first round of problem solving (the top left corner of the matrix). Although they can wait a while, they still need to be done PowerPoint instructions It’s usually easiest to manually generate these matrices rather than assigning a numerical value and using a graphical chart. This allows you more precision in labelling Tool summary videos are available at: Find more tools and templates at: http://www.youtube.com/2020Delivery www.2020delivery.com/services/capability-building/resources Creative Commons Attribution-ShareAlike 3.0 Unported License - you may use and share this file, but please attribute it to www.2020delivery.com 1 <Message> – e.g., “We are going to focus on X and Y in the first phase of the project” EXAMPLE ANALYSIS PRIORITISATION MATRIX xxx xxx High xxx Impact xxx xxx xxx Low xxx Low High Level of control Creative Commons Attribution-ShareAlike 3.0 Unported License - you may use and share this file, but please attribute it to www.2020delivery.com 2
