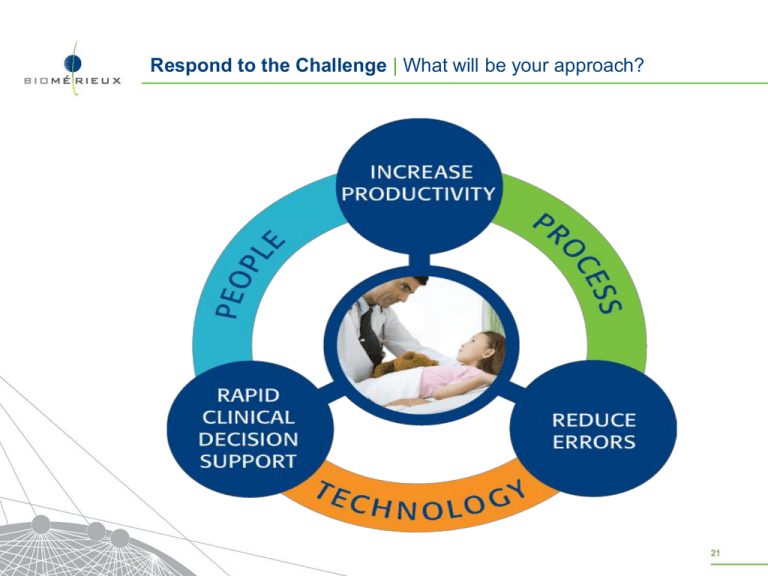
RespondOptimization
to the Challenge
| What willapproach
be your approach?
Workflow
| Our assessment
1
People: The rate limiting factor of Change
Resistance to change is a significant barrier to realizing results and savings
When pursuing transformations, organizations rarely realize the benefits or retain the value they
anticipated. While there are many reasons for this, the following survey of CEO’s shows that 5 out
of the top 10 business transformation showstoppers are ‘people and organizational’ issues.
Top
Resistance
Case
Sponsorship
Unrealistic
Expectations
72%
65%
54%
Project Management
for Change not Compelling
Project
Scope
No
82%
to Change
Inadequate
Poor
10 Barriers to Success
46%
Team Lacked Skills
44%
Expansion / Uncertainty
44%
Change Management Program
Not
IT
43%
Horizontal Process View
41%
Perspective not Integrated
36%
PERCENT
“Source:
“Soft skills”?
Hard Impact.
OF FIRMS
Deloitte & Touché Survey of CEO's regarding Business Transformation: Top 10 Barriers to Success, 2004.”.
2
Process of Change Management
Commitment to change
Change is managed effectively
COMMITMENT
ADOPTION
GO-LIVE
• Project Rework
• Sub-Optimized Delivery
• Lack of Project Team and
Leadership Alignment
• Delay/No Adoption
• Missing Accountability
• Minimized/Missed Benefit
Realization
• Lost Investment Opportunity
UNDERSTANDING
UNAWARE
AWARENESS
CONFUSION
NEGATIVE PERCEPTION
Time
GO-LIVE
SUPPORT WITHDRAWN
ROI PROJECT TERMINATED
Change is not managed
3
Creating the “LEAN” Microbiology Lab
1. Strategic Assessment
2. Transformation
Unbiased LEANSigma observation
and data analysis of your lab
Collaborative group effort
Kaizen events
Rapid Improvement Workshops
Staff schedules
Staff priorities
Volume patterns
Turnaround time analysis
Specimen physical flow
Value streams
Unnecessary or
over-processing
opportunities
4
Strategic Assessment
Strategic Assessment
Pre-work
• Introductory
visit with site
leadership
• Pre-audit data
request
• Type/volume of
samples
• Segmented
staffing data
• Working hours
• Organization
chart
• Performance
metrics
• Building layout
• Discuss
challenges
Kick-off
• Introductions &
kick-off
• Review schedule
• Walk the process
• Data gathering
• Pareto analysis
• Physical Layout
• "Cycle time
analysis' or
snapshot
observation
• Volume arrival
patterns
• Spaghetti
diagrams
Data
Collection
Future
state
• Current state
value stream
map
• Lead time
analysis
• Interviews
• Data analysis
potential linkages
between
observation and
performance
• Current state
data validation
with site
leadership
• Define
"improvement
roadmap”
• Process
• Layout
• Staffing
• Equipment
• Future state
definition
Report-out
• Prepare final report
• Recommendations
for improvement
• Quantify benefits
• Review
opportunities and
next steps with
stakeholders
5
What is Important to the patient?
Wasted Time & Activity
Core Process Value
Backlog of
requests
Excessive Motion
(Walking to Next Task, etc.)
Defective Process
(Identifying, Handling, Fixing)
OPERATIONAL LEAD TIME
Missing
Information
Waiting
for next Process
Review/QA
Call or Log
information
Key: Improved Processes to Increase “Core Value”
© 2009 Guidon Performance Solutions, LLC. All rights reserved. Guidon Performance Solutions is a licensee of LEAN
Sigma®,
a service mark of TBM Consulting Group.
You must optimize the whole, not just the parts…
7
Transformation
Kaizen Event: Transformation
Pre-work
• Review
opportunities and
next steps with
stakeholders
• Pre-visit
planning
Kick-off
• Collaborative
group engagement
• Lean training
Current
state
• Map the current
state from
specimen receipt
to result
• Review the
process for
improved
turnaround times,
eliminate waste,
reduce errors,
minimize
touches.
Future
state
Follow up
• Standardize the
process
• Develop and map
the new process
• Assign ownership
of key tasks
• Training in change
management
• Recommendations
for improvement
8
• Prepare final report
• Follow up to
measure
improvements
5 S Projects
:| |Organization
Methodology
Workflow
Optimization
Our assessment approach
Before
After
9
Lab Planning | Designing the Future Laboratory
Defining the future laboratory and meeting the needs for growth
Current
and future state analysis
Technology and infrastructure options that facilitate change
Design approaches that facilitates lean and workflow optimization
Lab space planning and design
Approaches to lab automation
Technology assessments
Workflow planning
Lab Relocations
10
Lab Transformation
:| Keys
to Success
Workflow
Optimization | Our assessment
approach
11
Examples of performance improvement – Maximize Quality
Performance Improvement:
• Over 1100 urine were contaminated/month
• 50% were causing re-work and over-processing
• Design new process and monitor improvement
>80%
Reduction in Contamination
We saw improvements quickly (over two months).
Over 6 months, contamination from 18% to < 4%
Reduce cost by $30k per month
12
Examples of performance improvement – Rapid Decision Support
• Identify drivers for this distribution
• Design new process and monitor improvement
6 months later
Median: 87 hour 63 hour
Top 25%: 119 hour 89.1 hours
13
Performance Improvement
24
hours
Example of performance improvement – Patient Centric
“Two years later, the results on workflow, turnaround times (TATS),
and patient outcomes have been dramatic.”
Joseph Campos, Ph.D.
Director of the Microbiology and Molecular Diagnostics Laboratories
Children’s National Medical Center
14
In summary
Clinical microbiology will remain a “growth based” science
Automation will remove “touches” from the manual
process, but will not be effective unless you transform your
workflow to maximize the technology investment
We must focus on efficient delivery of clinically relevant
results in order to accelerate therapeutic decisions and
improved patient outcomes
Performance Assessment and Transformation is a Quality
Initiative
Focus is on processes and systems that serve the Patient
Improve level of service and customer satisfaction
Improve employee satisfaction
Free up resources and be prepared for increasing test volumes
15
16

