Time Series Graphs
advertisement
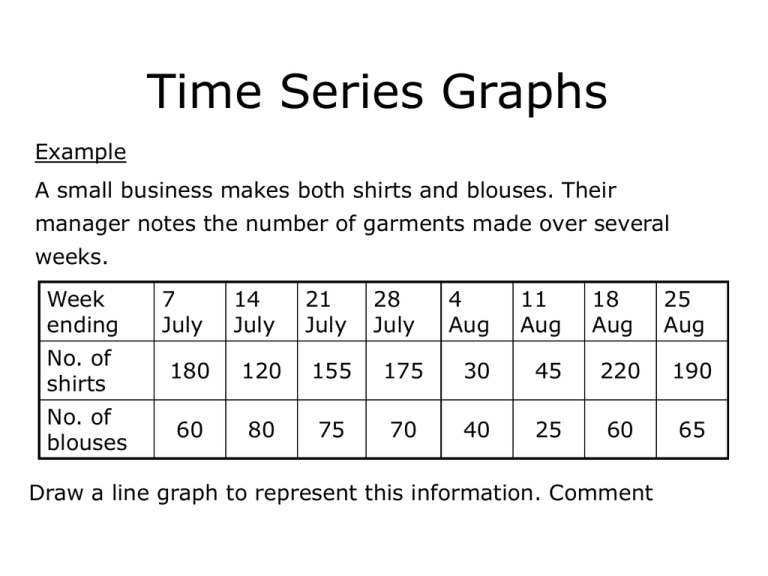
Time Series Graphs Example A small business makes both shirts and blouses. Their manager notes the number of garments made over several weeks. Week ending No. of shirts No. of blouses 7 July 14 July 21 July 28 July 4 Aug 11 Aug 18 Aug 25 Aug 180 120 155 175 30 45 220 190 60 80 75 70 40 25 60 65 Draw a line graph to represent this information. Comment Example In a certain part of Worcestershire, the area of land planted with various crops changes over the years. y 3000 WHEAT 2000 BARLEY 1000 OATS 0 1978 1979 1980 1981 1982 1983 x a) Which crop has the least change of area during this period? b) Which was the most common crop in 1979? c) How many hectares were given to each crop in 1980? d) Between 1980 and 1982, the area of wheat increased. Suggest how some of this land became available for wheat.
