1.1 powerpoint
advertisement
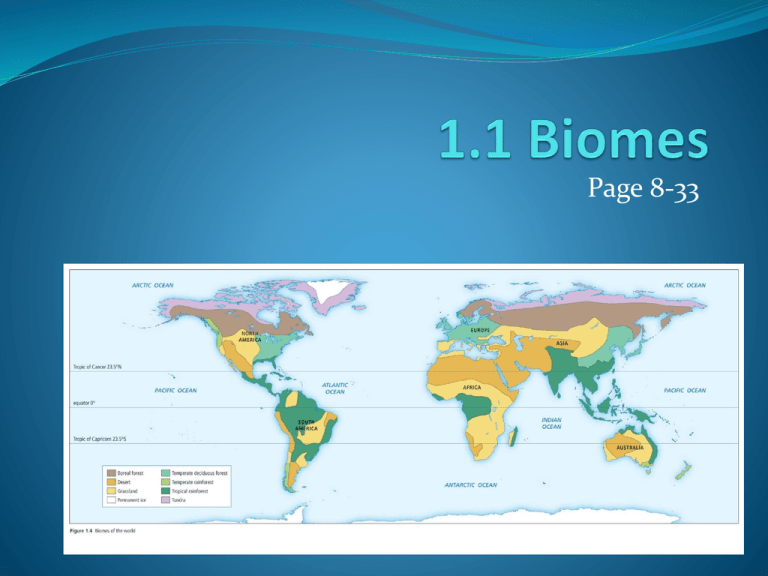
Page 8-33 What is a Biome? The biosphere is a thin layer of air, land and water on our near Earth’s surface where living things exist. Scientists study the biosphere by breaking it down into smaller divisions (from largest to smallest): Biome: largest division of the biosphere, which includes large regions with similar biotic components & similar abiotic components Ecosystem: part of biome in which abiotic components interact with biotic components Habitat: place in which organisms live A biome is a region with similar biotic and abiotic components. Biotic= living things (e.g. Plants, animals, fungi, and bacteria) Abiotic = non-living things (e.g. sunlight, soil, moisture, and temperature) What are Earth’s biomes like? A large portion of the Earth’s biosphere consists of fresh water and oceans. These aquatic biomes are essential for terrestrial life. Marine algae supply at least 75% of the world’s oxygen and remove large amounts of carbon dioxide from the atmosphere. Seawater that evaporates produces rainfall for terrestrial life. We will be focussing on Earth’s eight terrestrial (land-based) biomes: tundra, boreal forest, temperate deciduous forest, temperate rainforest, grassland, tropical rainforest, desert, & permanent ice Biomes are complex due to the interactions between biotic and abiotic factors. Activity #1 Observing Patterns in World Biomes Please refer to your worksheet package and pg 10-11 of your textbook Complete activity with partner When done, begin reading pg. 10-17 and begin to complete “Biome Distribution Basics” worksheet You may work with a partner as long as the noise level remains low and you are working TOGETHER (no copying) What factors influence the characteristics and distribution of biomes? Two of the most important abiotic factors that influence the characteristics of biomes and the distribution of biomes on Earth are temperature and precipitation. Precipitation includes rainfall, snow, mist & fog. Refer to the graph below (and on page 13 of your text) in order to answer the Practice Problems that follow. The graph shows the 8 terrestrial biomes in relation to average annual precipitation and average annual temperature. Practice Problems Try the following biome identification problems yourself. Identify the biome of each region using the data provided. 1. The region has an average annual precipitation of about 175 cm and an average annual temperature of 5°C. Boreal forest 2. The region ranges in temperature between 0°C and 20°C and receives about 100 cm of rain. Temperate deciduous forest 3. The region has low average annual precipitation and an average annual temperature that ranges between -18°C and 8°C.Tundra 4. The region has high average annual precipitation and an average annual temperature of 15°C. Temperate rainforest The overlap between the biomes on the graph above indicates that there are other factors that influence temperature and precipitation. These factors include latitude, elevation and ocean current. Latitude Latitude, the distance measured in degrees north or south from the equator, affects temperature and precipitation. The equator, which is at 0° latitude divides the earth into the north and south equator. The sun shines down on the equator almost directly providing 12 hours of sunshine every day throughout the year. Therefore tropical zone, since it is located directly above and below the equator, experiences little annual fluctuations in temperature. North and south of the tropical zone, the sun’s rays hit Earth’s surface at an angle, due to the tilt of Earth. The sun’s rays are less intense the further they are from the equator giving rise to lower temperatures in what are called the temperate zones. Precipitation is also affected by latitude. At the equator, the direct sunlight heats moist air which rises, cools in the upper atmosphere and falls back to Earth as rain. (The land and ocean at the equator receives the greatest amount of rainfall on Earth) In polar regions, the temperature of the air is too cold to pick up and retain moisture so there is very little precipitation. Cold air masses from the polar regions collide with warm air masses from the tropics within the temperate zones. Seasonal rainfall patterns result. Elevation Elevation, the height of a land mass above sea level, also has an effect on temperature and precipitation. The atmosphere becomes colder at higher elevations and therefore retains less moisture. Ocean Currents Ocean currents are another abiotic factor that affects temperature and precipitation. The coast of our province is affected by ocean currents making it warmer and wetter than other temperate biomes. What are climatographs? Climate is the average pattern of weather conditions that occur in a region. A climatograph is a graph of climate data for a specific region. It includes average monthly temperature and an average of the total monthly precipitation for each month. They can be used to compare temperature and precipitation patterns among different regions within a biome or regions in different biomes. How are organisms adapted to the specific conditions of their biome? Biomes are often identified with characteristic plants and animals, such as a cactus in the desert or a caribou on the tundra. The plants and animals within a certain biome are usually better adapted to the environmental conditions unique to that biome. An adaptation is a characteristic that enables an organism to survive and reproduce. There are three types of adaptations: structural, physiological and behavioural. A structural adaptation is a physical feature of an organism’s body that helps it survive in its environment. For example, a wolf has large paws to help it run in the snow. A Physiological adaptation is a physical or chemical event within the body of an organism that allows it to survive. For example, a wolf maintains a constant body temperature. A behavioural adaptation is a action that helps an organism to survive. For example, wolves hunt in packs to capture large prey. Biome Cards Mini-Book /25 On the following 8 Biome Cards, complete the table using pages 20-28 Be sure to include 1-2 examples of plants/animals characteristic to each biome Cut out the table, picture, climatograph and map and mount on coloured construction paper Create a cover page titled “Biomes of the World” and a back page that has your name and block. Due date: Monday Sept 10 20 marks for correct information 5 marks for display Analyzing Climatographs Part 1: work with a partner to answer questions a-f Part 2: Create your own climatograph using the pre- made plot and data from pg 31. Part 3: Compare climatograph A to your climatograph B Part 4 Analyze: complete questions 1-5, you will need to look at and compare climatographs from pg 20-28 Part 5: Conclude and Apply: Complete on your own
