Slide 1 - The Sustainability Society
advertisement
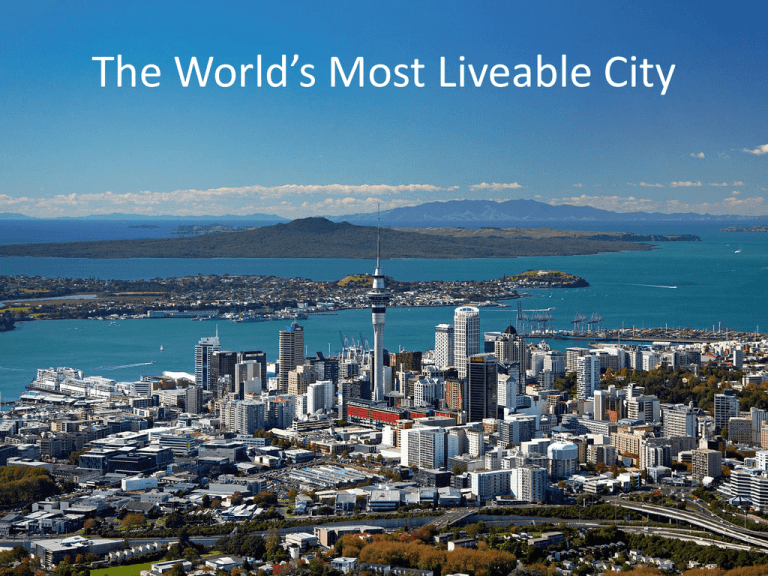
The World’s Most Liveable City “Despite the technological breakthroughs that have caused the death of distance, it turns out that the world isn’t flat, it’s paved. The city has triumphed” Glaeser, 2010 Liveable for who? Largest New Zealand regions 2,000,000 1,800,000 1,600,000 1,400,000 Population 1,200,000 Auckland Canterbury 1,000,000 Wellington Waikato 800,000 Otago 600,000 400,000 200,000 1935 1945 Source: Statistics New Zealand 1955 1965 1975 1985 1995 2005 2015 2025 2035 An additional person every … 250 221 200 Minutes 150 99 100 103 63 50 17 0 Auckland Christchurch Source: Statistics New Zealand, Auckland Council calculations Wellington Hamilton Dunedin The lure of Auckland . . . 15000 Annual net migration flow 10000 5000 0 -5000 -10000 Auckland Source: Statistics New Zealand Rest of New Zealand Apr-12 Apr-11 Apr-10 Apr-09 Apr-08 Apr-07 Apr-06 Apr-05 -15000 Mercer Liveability Survey 0 Source: OECD Regions at a Glance 2011 Daejeon Busan Jeollabuk-Do Okinawa Gyeonggi-Do Gangwon-Do Nagasaki North Island = 56th Miyazaki Chungcheongbuk-Do Kagoshima Aomori Tokushima Iwate Wakayama Akita Hyogo Saga Yamagata Tasmania Kagawa Fukuoka Gumma Niigata South Australia Kyoto Jeollanam-Do Yamaguchi Fukui Qeensland Hiroshima Shiga Osaka Chungcheongnam-Do Western Australia Australian Capital… Tokyo GDP per capita (PPP) Regional GDP per capita in Asia-Pacific region South Island = 64th 60 50 40 30 20 10 The GFC and GDP per capita $60,000 Year to Sep. 2012: $55,000 Auckland GDP per capita = $50,200 $7,100 gap $50,000 $45,000 AKL GDP per capita Source: Statistics NZ, Infometrics Linear (2001-2008 Trend) Sep-12 Sep-11 Sep-10 Sep-09 Sep-08 Sep-07 Sep-06 Sep-05 Sep-04 Sep-03 Sep-02 $40,000 Sep-01 Annual real AKL GDP per capita ($2012) Auckland real GDP per capita Our economic targets: A 6% PLUS INCREASE IN REGIONAL EXPORTS A- 5% A 5% PLUS PLUS INCREASE INCREASE IN IN REAL REAL GDP GDP A 2% PLUS INCREASE IN PRODUCTIVITY GROWTH Unemployment rate Auckland & New Zealand 9.0% Year to Dec. 2012: 8.0% Moving Annual Average 7.0% 6.0% Auckland 7.7% RoNZ 6.5% 5.0% NZ Treasury forecasts: 4.0% 3.0% 2.0% 1.0% 2013 5.8% 2014 5.3% 2015 5.0% 2016 4.7% Auckland Source: Statistics New Zealand New Zealand Dec-12 Jun-12 Dec-11 Jun-11 Dec-10 Jun-10 Dec-09 Jun-09 Dec-08 Jun-08 Dec-07 Jun-07 Dec-06 Jun-06 Dec-05 Jun-05 Dec-04 Jun-04 Dec-03 Jun-03 Dec-02 0.0% Unemployment by qualification Auckland, annual average 50% 40% 30% 20% 10% No School qualification Source: Statistics New Zealand Total Dec-12 Dec-11 Dec-10 Dec-09 Dec-08 Dec-07 Dec-06 Dec-05 Dec-04 Dec-03 Dec-02 0% Public services and transport criteria International competitiveness The 2010/11 Global Competitiveness Report highlighted inadequate infrastructure as the biggest problem facing businesses in New Zealand Aotea Station City Rail Link Stations & Parnell Under Albert St between Victoria & Wellesley streets 18 metres underground Entries on Wellesley & Victoria streets Parnell Station Near Mainline Steam Opens Sept. 2012 Access to Parnell & University Newton Station K Road Station Under Pitt St between Beresford Square & K Rd 35 metres underground Entry on Beresford Square Under Symonds St between Newton Rd & Mt Eden Rd 43 metres underground Entries on Mt Eden Rd & Symonds St City Rail Link Transport Benefits How short sighted are we? United Kingdom vs New Zealand approach discounted $m, discounted 300 250 250 200 150 100 50 0 01 56 11 15 16 20 21 25 26 30 31 3536 4041 4546 5051 5556 6061 10 Year(after (after2011) 2011) Year UK approach Standard NZ appraisal • Long lived projects dramatically more viable Congestion Auckland Productivity Premium The geography of economic activity matters Auckland Region Relative to rest of NZ Auckland urban Relative to rest of NZ Auckland CBD Relative to rest of NZ Rest of New Zealand Source: MOTU $ 65,375 44% $ 68,435 51% $ 106,873 139% $ 45,440 “A material measure of wellbeing such as GDP … is an insufficient index for measuring aggregate wellbeing” Grimes, 2012 “The top 1 percent gained 93 percent of the additional income created in the country in 2010” Joseph Stiglitz, 2012 • • • • • Wealth/Jobs Transport Environment Inequality Sustainable future

