(NC).
advertisement
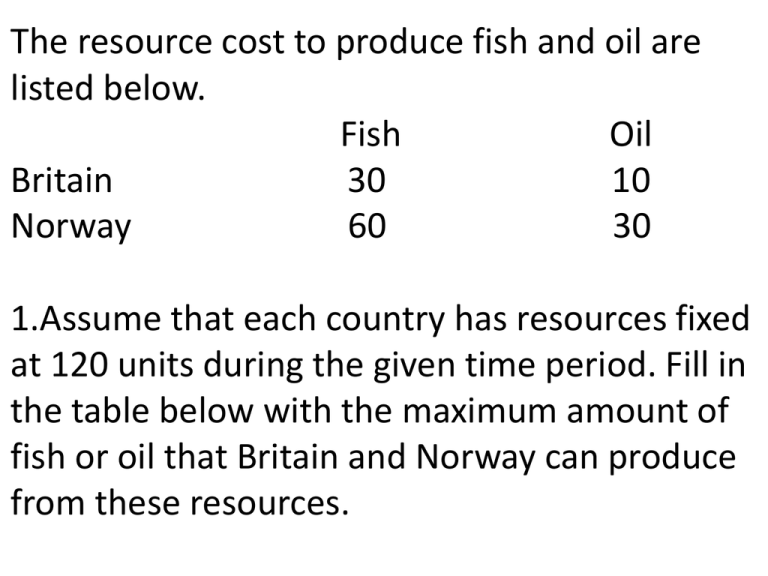
The resource cost to produce fish and oil are listed below. Fish Oil Britain 30 10 Norway 60 30 1.Assume that each country has resources fixed at 120 units during the given time period. Fill in the table below with the maximum amount of fish or oil that Britain and Norway can produce from these resources. Fish Oil Britain 4 12 Norway 2 4 1.What is the opportunity cost of producing 1 ton of fish in Britain? 3 tons of oil 2.What is the opportunity cost of producing 1 ton of fish in Norway? 2 tons of oil 3.Which country has an absolute advantage in the production of fish? Britain 4.Which country has a comparative advantage in the production of fish? Norway In the next figure, assume that the economy is operating at point A. wheat B 30 10 A 20 Soybeans 1. Why might the economy be operating at point A? Because the economy is in a recession 2. What is the opportunity cost of moving to B? There is no opportunity cost because you are not simply shifting production, you are increasing the the overall production of the economy Liza needs to buy a textbook for her Economics class tomorrow. The price at the college bookstore is $65. One online site offers it for $55 and another site, for $57. All prices include sales tax. The accompanying table indicates the typical shipping and handling charges for the textbook ordered online. Shipping method Standard shipping Second-day air Next-day air Delivery time 3–7 days 2 business days 1 business day Charge $3.99 $8.98 $13.98 8. What is the opportunity cost of buying online instead of at the bookstore? Note that if you buy the book online, you must wait to get it. THE SHIPPING TIME BECAUSE IN ORDER TO GET A DEAL ON THE PRICE, YOU HAVE TO DO 2 DAY SHIPPING OR MORE 9. Show the relevant choices for Liza. What determines which of these options Liza will choose? 1) BUY THE BOOK @ BOOKSTORE @ $65 2)BUY BOOK ONLINE @ $63.98 ($55 + 8.98 2-DAY SH) 3) BUY BOOK ONLINE @ $58.99 ($55 + 3.99 3-7 DAY SH) $5 D1 D2 S1 $4 S2 $3 $2 $1 200 400 600 800 1000 $3 10. EP 1: ______ $3 11. EP 2: ______ 12. What might cause the shift in supply from S1 to S2? MORE RESOURCES OR BUNS BECOME CHEAPER 13. What might cause the shift in demand from D1 to D2? PEOPLE ARE JUST HUNGRIER M 14. What will happen to the supply curve for iPads if _____ Apple lowers the selling price of them? SI 15. What will happen to the supply curve for _____ automobiles if Nissan was to leave the auto industry? SI 16. What will happen to the supply curve if Nintendo _____ predicts it will sell the Wii at a lower price? SI 17. What will happen to the supply curve for solar _____ panels if the federal government rejects a subsidy to help pay for the costs? M 18. What will happen to the supply curve for pizza if _____ Edies raises the prices of its pizzas? SO 19. What will happen to the supply curve if Moog _____ workers become more efficient? S1 $30 S2 $20 $10 200 400 600 800 1000 20. What happened to the supply curve for National Fuel? THE CURVE SHIFTED OUT 21. Which factor of change caused this change? NEW RESERVES FOUND THAT ARE EASILY ACCESSIBLE M 22. What will happen to the demand curve for IBM if they ____ lower the price of their PC’s? SO 23. What will happen to the demand curve for bottled ____ water if there is a hot week forecasted? SO 24. What will happen to the demand curve for chocolate ____ the week leading up to Valentine’s Day? SO 25. What will happen to the demand curve for Sabres ____ Jerseys at the beginning of the NHL Season? $5 D1 D2 $4 $3 $2 $1 200 400 600 800 1000 1200 26. Does it shift left, shift right or move along the curve? SHIFT RIGHT ____________________________ 27. What factor of change causes this? IT’S A HOTTER DAY __________________________________________ Please choose whether the following is: 1. Elastic 2. Inelastic 2 28. Water ____ 2 29. Salt ____ Match the curve with its label. A. Elastic demand curve B. Inelastic demand curve C. Elastic supply curve D. Inelastic supply curve 1 30. Coffee ____ 1 31. Chocolate ____ B 32.) ______ C 34.) ______ D 33.) _____ A 35.) ______ Directions: For each of the following, indicate whether the group would be classified as Employed (E), Unemployed (U), or not counted (NC). Wharton, TX has a population of 9,000. Of that 9,000: E 36. ________ a. 6,000 work as paid employees. U b. 1,100 are unemployed, but are looking for work. 37. ________ NC c. 1,400 are unemployed and have given up looking for work. 38. ________ NC d. 450 are retired and go fishing daily. 39. ________ NC e. 50 quit their jobs last year to go back to college. 40. ________ Now, calculate the following: 7,100 41. How many people would be included in the workforce? ________ 15.5% 42. What is the unemployment rate for Wharton, TX? ________ 1,400 43. How many people from above would be considered discouraged workers? ________ Directions: Answer questions by filling in an A (Traditional), B (Command), or C (Market) on the space provided. A 44. Which economic system rejects new methods of farming? _____ C 45. Which economic system allows for the greatest individual freedom? _____ A 46. Which economic system features gender-based roles for its members and _____ offers predictability and stability? C 47. Which economic system can change production goals quickly? _____ B 48. Which economic system is based on government directives? _____ In 2012 you bought a used car for $4000. It was originally purchased in 2004 for $13,000. You have your mechanic look it over and fix some things on it for a cost of $550. 2 49. How many dollars would be recorded in 2012 GDP? ____ 1.$100 2. $550 3. $4550 4. $13,000 4 50. How many dollars would be recorded in 2004 GDP? ____ 1.$100 2. $550 3. $4550 4. $13,000

