Is the weather in the UK becoming more
extreme?
Learning Objective:
1) To know the evidence that suggest the UK weather is becoming more extreme
2) To understand the impact of more extreme weather on people’s homes and lives,
agriculture, health, transport- benefits and costs and issues raised- the need for
more adequate warning, preparation, plans to deal with impacts.
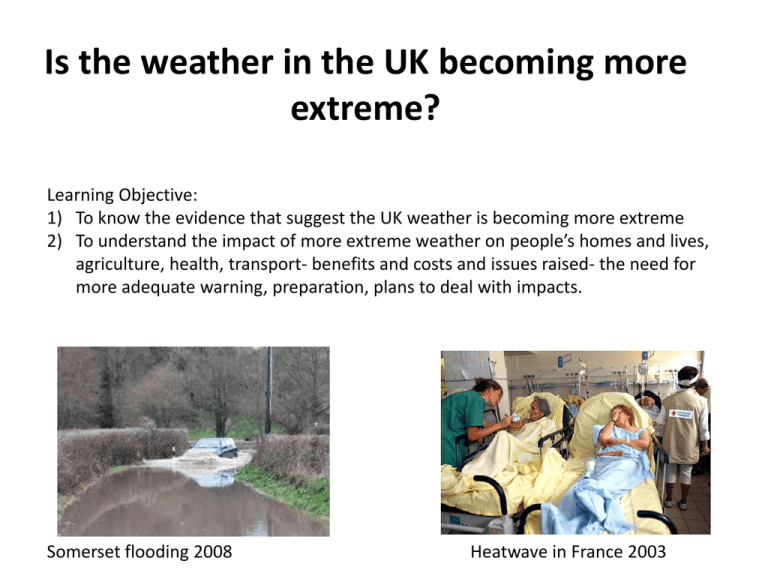
Somerset flooding 2008
Heatwave in France 2003
What is the evidence of extreme weather events
in the UK?
Richard Benyon visits flood-hit Morpeth
http://www.bbc.co.uk/news/uk-england-tyne19733712
Heatwave in Northern Europe- weather forecast
http://news.bbc.co.uk/1/hi/uk/8812801.stm
Extreme weather causes shortage of rock salt
http://www.bbc.co.uk/learningzone/clips/extreme-weathercauses-shortage-of-rock-salt/6026.html
Heatwave in France
http://www.youtube.com/watch?v=Hx2940wc
ooo
Hull not over 2007 floods
http://news.bbc.co.uk/1/hi/uk/7387685.stm
Extreme weather: a weather event such as a flash flood or severe snowstorm
that is significantly different from the average and what is normally expected.
Examples include:
• Very cold winter- ‘long cold snap/ big freeze’
• Very hot in summer- ‘heatwave/ sunny summers like the summer of 1995
• Heavy rain- ‘cloudburst leading to a flash flood’/ ‘one month’s rain falling in
just a few hours’
• Drought- ‘many months without significant rainfall’
• Gales- ‘gale and storm force winds’/ ‘the hurricane of October 1987’
• Snow- ‘blizzards’/ winters famous for heavy snowfalls like the winters of 1947
and 1962/3
• Fog- thick fog night and day/ ‘fog causes motorway chaos’.
The UK cannot experience a real hurricane (it lies too far from the tropics), nor a winter
deep freeze as in Canada and Siberia (it is too close to the warm Atlantic Ocean).
However, people and businesses adapt their activities and operations to average
conditions, with only slight variations. Radiation fog can be expected in winter with
anticyclonic weather. However, when this type of fog persists all day; day after day, it
often causes major traffic disruption on the motorways and at the airports.
Most of the 7 extreme events listed above are caused by the depression or anticyclonic
weather, which is either more intense or lasts longer than usual. The variety, which is a
characteristic of the UK’s weather, is temporarily lost.
The graph shows the pattern of the UK monthly rainfall variation from January 2004 to
July 2007. Describe the rainfall distribution for the 3 years: 2004, 2005, 2006.
How does the data for 2007 shown in Figure 2 below differ from the data for the previous
three years?
The driest year was 2005, when south-east England received only 66 to 80% of
average rainfall. By January 2006, alarm bells were ringing here about future
water shortages.
2007 is by far the wettest year comparing figures to July with the previous
years
There is no other consecutive three month spell with such a high variation
from the norm
Also no other year has four months outside of the 50% range
2007 also contains the largest negative anomaly (April at 40 below average)
There are good physical and social reasons why south-east England is always going to be
the area at the greatest risk of drought.
• Average rainfall is low in the south-east
• It is the last part of the UK to be reached by Atlantic fronts
• It is mostly lowland, with few good natural sites for reservoirs
• Underground water stores are being used up faster than they are being replenished
• It is experiencing population growth and there are plans for a lot of new houses

