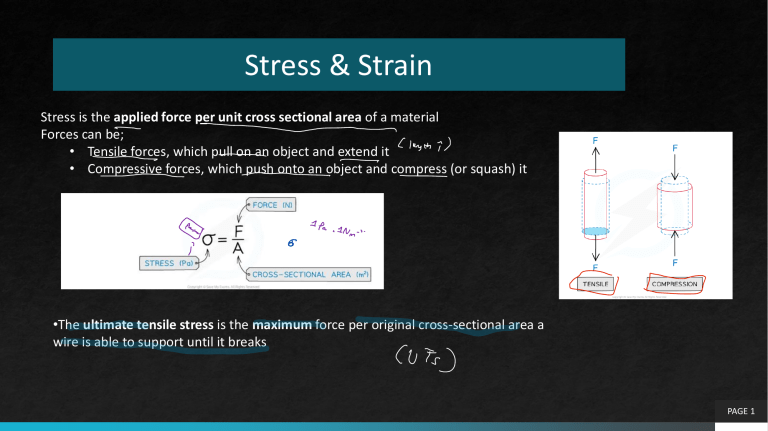
Stress & Strain Stress is the applied force per unit cross sectional area of a material Forces can be; • Tensile forces, which pull on an object and extend it • Compressive forces, which push onto an object and compress (or squash) it •The ultimate tensile stress is the maximum force per original cross-sectional area a wire is able to support until it breaks PAGE 1 Strain Strain is the extension per unit length This is a deformation of a solid due to stress in the form of elongation or contraction Note that strain is a dimensionless unit because it’s the ratio of lengths PAGE 2 Strain The Young modulus (sometimes called Young's Modulus) is the measure of the ability of a material to withstand changes in length with an added load ie. how stiff a material is This gives information about the elasticity of a material The Young Modulus is defined as the ratio of stress and strain •Its unit is the same as stress: Pa (since strain is unitless) •Just like the Force-Extension graph, stress and strain are directly proportional to one another for a material exhibiting elastic behaviour The gradient of a stress-stress graph when it is linear is the Young Modulus PAGE 3 Example Question A metal wire that is supported vertically from a fixed point has a load of 92 N applied to the lower end. The wire has a cross-sectional area of 0.04 mm2 and obeys Hooke’s law. The length of the wire increases by 0.50%.What is the Young modulus of the metal wire? PAGE 4 Force-Extension Graphs •The way a material responds to a tensile or compressive force can be shown on a force-extension, or a force-compression graph • Although compression can be put into equations as a negative value, the graphs have the same shaped curves • Compression is plotted on the graph as a positive, increasing value •Every material will have a unique force-extension graph depending on how brittle or ductile it is •In the same way, materials have unique force-compression graphs, which will not be the same as their force-extension graph • This is because materials behave differently under tensile and compressive strain PAGE 5 Force-Extension Graphs •A material may obey Hooke's Law up to a point • This is shown on its force-extension graph by a straight line through the origin •As more force is added, the graph may start to curve slightly The key features of the graph are: •The limit of proportionality • The point beyond which Hooke's law is no longer true when stretching or compressing a material i.e. the extension/ compression is no longer proportional to the applied force • The point is identified on the graph where the line starts to curve •The elastic limit • The point before which a material will return to its original length or shape when the deforming force is removed • This point is always after the limit of proportionality •The spring constant k is found from the gradient of the straight part of the graph PAGE 6 Force-Extension Graphs •Graphs of applied load-extension can give more detailed information about materials • This will apply when loads were continued well past the elastic limit •The yield point is where the material continues to stretch even though no extra force is being applied to it •Elastic deformation is a change of shape where the material will return to its original shape when the load is removed •Plastic deformation occurs after the yield point • It is a change of shape where the material will not return to its original shape when the load is removed PAGE 7 Example Questions PAGE 8 Stress-Strain Graphs •Stress-strain curves give an indication of the properties of materials such as • Up to what stress and strain they obey Hooke's Law • Whether they exhibit elastic and/or plastic behaviour • The value of their Young Modulus • The value of their breaking stress •Each material has a unique stress-strain curve PAGE 9 Stress-Strain Graphs The key features of the graph which are also on the forceextension graph are: •Limit of proportionality, beyond which Hooke's law no longer applies •The elastic limit, before which a material returns to its original length or shape when the deforming force is removed •The yield point beyond which the material continues to stretch (more strain is seen) even though no extra force is being applied to it (without additional stress) •Elastic deformation where the material will return to its original shape when the load is removed •Plastic deformation where the material will not return to its original shape when the load is removed PAGE 10 Stress-Strain Graphs The stress-strain graph is also used to find; •The Young Modulus is found from the gradient of the straight part of the graph •Breaking stress (also called fracture stress) is the stress at the point where the material breaks • At the yield point the atoms in the material had started to move relative to each other, at the breaking stress they separate completely • Breaking stress is not the same as ultimate tensile stress which is marked on many graphs PAGE 11 Example Questions PAGE 12 THANK YOU PAGE 13
