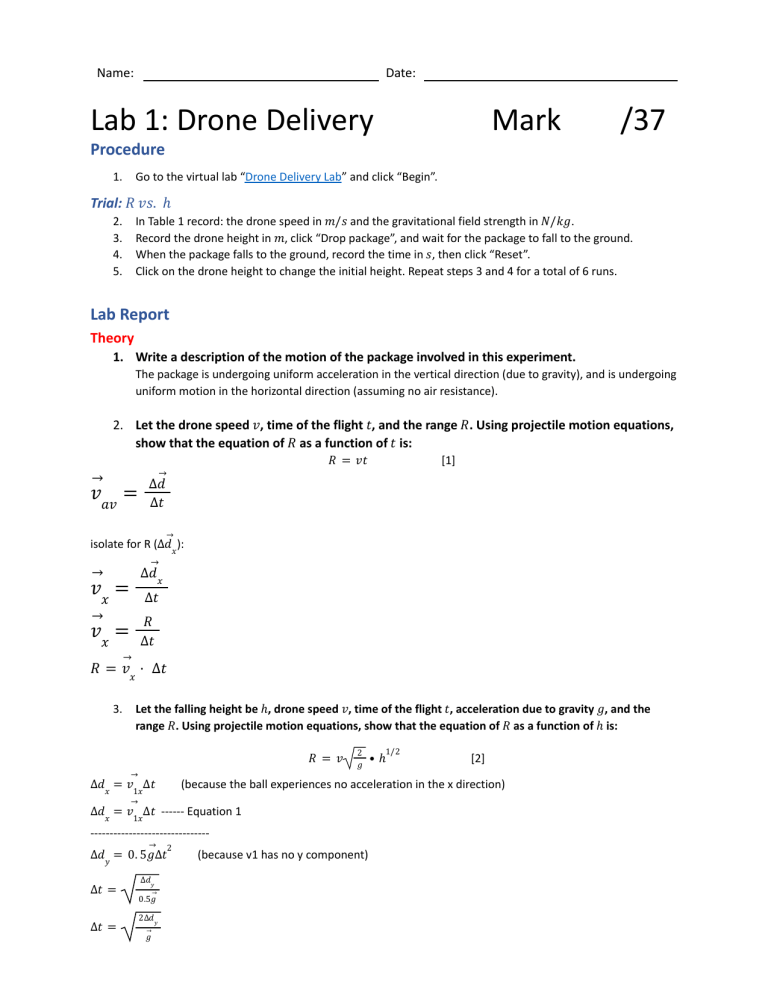
Name: Date: Lab 1: Drone Delivery Mark /37 Procedure 1. Go to the virtual lab “Drone Delivery Lab” and click “Begin”. Trial: 𝑅 𝑣𝑠. ℎ In Table 1 record: the drone speed in 𝑚/𝑠 and the gravitational field strength in 𝑁/𝑘𝑔. Record the drone height in 𝑚, click “Drop package”, and wait for the package to fall to the ground. When the package falls to the ground, record the time in 𝑠, then click “Reset”. Click on the drone height to change the initial height. Repeat steps 3 and 4 for a total of 6 runs. 2. 3. 4. 5. Lab Report Theory 1. Write a description of the motion of the package involved in this experiment. The package is undergoing uniform acceleration in the vertical direction (due to gravity), and is undergoing uniform motion in the horizontal direction (assuming no air resistance). 2. Let the drone speed 𝑣, time of the flight 𝑡, and the range 𝑅. Using projectile motion equations, show that the equation of 𝑅 as a function of 𝑡 is: 𝑅 = 𝑣𝑡 [1] → → 𝑣𝑎𝑣 = ∆𝑑 ∆𝑡 → isolate for R (∆𝑑𝑥): → → ∆𝑑𝑥 𝑣𝑥 = ∆𝑡 → 𝑅 ∆𝑡 𝑣𝑥 = → 𝑅 = 𝑣𝑥 · ∆𝑡 3. Let the falling height be ℎ, drone speed 𝑣, time of the flight 𝑡, acceleration due to gravity 𝑔, and the range 𝑅. Using projectile motion equations, show that the equation of 𝑅 as a function of ℎ is: 𝑅=𝑣 → ∆𝑑𝑥 = 𝑣1𝑥∆𝑡 2 𝑔 ∆𝑑𝑥 = 𝑣1𝑥∆𝑡 ------ Equation 1 ------------------------------2 ∆𝑑𝑦 = 0. 5𝑔∆𝑡 ∆𝑡 = ∆𝑡 = ∆𝑑𝑦 → 0.5𝑔 2∆𝑑𝑦 → 𝑔 [2] (because the ball experiences no acceleration in the x direction) → → 1/2 •ℎ (because v1 has no y component) 2 ∆𝑡 = → 𝑔 · ∆𝑑𝑦 -------------Equation 2 Plug Equation 2 into Equation 1: → 2 ∆𝑑𝑥 = 𝑣1𝑥 · → 𝑔 → 2 ∆𝑑𝑥 = 𝑣1𝑥 · → 𝑔 → 2 ∆𝑑𝑥 = 𝑣1𝑥 · → 𝑔 · ∆𝑑𝑦 · ∆𝑑𝑦 · ∆𝑑𝑦 Because there is no air resistance, there is no acceleration, meaning 𝑣1𝑥 = 𝑣2𝑥 = 𝑣𝑥. Additionally, because there is no initial Velocity in the y direction, 𝑣𝑥 = 𝑣. → 2 ∆𝑑𝑥 = 𝑣 · → 𝑔 ∆𝑑𝑦 The change in the y direction (∆𝑑𝑦) is also equal to the height from which the ball is dropped, so ∆𝑑𝑦 = ℎ the distance in the x direction that is covered (∆𝑑𝑥) is the range of the projectile, so ∆𝑑𝑥 = 𝑅. → 𝑅 =𝑣 → 𝑅 =𝑣 4. 2 → 𝑔 2 → 𝑔 · ℎ 1 · ℎ2 Describe four major assumptions that were made in the derivations above. - There is no air resistance (meaning there is no acceleration in the 𝑥 direction, leaving 𝑣𝑥 - - 5. constant), The initial velocity in the 𝑦 direction was 0 (assuming that the ball wasn't forced down, making the range shorter), The final position in the x direction that is recorded assumes the ball hasn't moved after hitting the ground, but it is possible for the ball to have rolled a very tiny distance away from the landing point. The gravitational field strength is constant, and is precisely 9.80 m/s2 [down] (any variation would mean the ball would travel further if the strength was lower, and the ball would travel a smaller distance if the strength was higher). In this experiment, ℎ was varied as 𝑅 was measured/calculated. a. What type of relationship do you expect if 𝑅 is plotted on the vertical axis and ℎ on the horizontal axis? (ex. Linear, Quadratic, Sinusoidal, Exponential) I expect a quadratic relationship. b. If the slope of the equation of the line of best fit, after linearizing the relation, is some value 𝑚, what is the meaning of it with respect to the relationship in equation [2] and its units. 𝑚 m would be the power to which our height variable will be raised to (ℎ ). c. If the constant term of the equation of the line of best fit, after linearizing the relation, is some value 𝑏, what is the meaning of it with respect to the relationship in equation [2] and its units. The constant term of the equation of the linearized relationship is the power to which 10 is raised 𝑏 to in our non-linearized equation. the value of 10 would be equal to the velocity of the drone, multiplied by 2 → 𝑔 . Name: Date: d. Write an equation for the gravitational field strength in terms of 𝑏 and 𝑣. → 𝑏 2 10 = 𝑣 · → 𝑔 → 𝑏 10 = 𝑣 · 2 · → 𝑏 10 = 𝑣 · 2 · 𝑏 10 ( → 𝑣· 2 1 → 𝑔 1 → 𝑔 → 2 ) = 𝑏 10 =( → 𝑣· 2 1 → 𝑔 1 → 𝑔 1 → 𝑔 2 ) 2𝑏 = 𝑔= 10 2 𝑣 ·2 2 2𝑣 2𝑏 10 Observations and Analysis 2. Complete the following table of observations for the Trial Data. Calculate Range using the equation in [2](a more precise value) Table 1: Trial Data (𝑣 = 2.5 𝑚/𝑠, 𝑔 = 9.8 𝑁/𝑘𝑔) 3.00 2.50 ℎ [𝑚] 2.00 1.50 1.00 0.50 𝑡 [𝑠] 0.778 0.714 .644 .549 .451 .320 𝑅 [𝑚] 1.60 1.40 1.30 1.10 0.90 0.70 3. Using a google spreadsheet program create a scatter plot with log ℎ on the x-axis and 𝑙𝑜𝑔 𝑅 on the y-axis. Perform a line of best fit to the data. 4. Use the value of 𝑚, from the line of best fit equation [see 3b], to determine an estimate for the exponent of ℎ. the value of 𝑚 in our log-log plot is 0.46, meaning our estimate for the exponent of h is 0.46 . 5. Use the value of 𝑏, from the line of best fit equation, to determine an estimate for the gravitational field 2 strength in 𝑚/𝑠 using the formula in [3d]. The value of 𝑏 in our log-log plot is − 0. 0297, and the velocity of our drone was 2. 5𝑚/𝑠. → 2 𝑔= 2𝑣 2𝑏 10 → 2 𝑔= → 𝑔= 2(2.5) 2*−0.0297 10 12.5 0.8721677022 → 2 𝑔 = 14. 33210605 𝑚/𝑠 [↓] → 2 𝑔 ≈ 14. 3 𝑚/𝑠 [↓] Error Analysis 10. Calculate the percent error of your measurements for each of cases above (#8, #9) using the formula: % 𝑒𝑟𝑟𝑜𝑟 = % 𝑒𝑟𝑟𝑜𝑟𝑃𝑜𝑤𝑒𝑟 𝑜𝑓 ℎ = |0.46−0.5| 0.5 % 𝑒𝑟𝑟𝑜𝑟𝑃𝑜𝑤𝑒𝑟 𝑜𝑓 ℎ = |−0.04| 0.5 |𝑒𝑥𝑝𝑒𝑟𝑖𝑚𝑒𝑛𝑡𝑎𝑙−𝑡ℎ𝑒𝑜𝑟𝑒𝑡𝑖𝑐𝑎𝑙| 𝑡ℎ𝑒𝑜𝑟𝑒𝑡𝑖𝑐𝑎𝑙 × 100% × 100% × 100% % 𝑒𝑟𝑟𝑜𝑟𝑃𝑜𝑤𝑒𝑟 𝑜𝑓 ℎ = 0. 08 × 100% % 𝑒𝑟𝑟𝑜𝑟𝑃𝑜𝑤𝑒𝑟 𝑜𝑓 ℎ = 8. 0% % 𝑒𝑟𝑟𝑜𝑟𝐺𝑟𝑎𝑣𝑖𝑡𝑦 = |𝑒𝑥𝑝𝑒𝑟𝑖𝑚𝑒𝑛𝑡𝑎𝑙−𝑡ℎ𝑒𝑜𝑟𝑒𝑡𝑖𝑐𝑎𝑙| 𝑡ℎ𝑒𝑜𝑟𝑒𝑡𝑖𝑐𝑎𝑙 % 𝑒𝑟𝑟𝑜𝑟𝐺𝑟𝑎𝑣𝑖𝑡𝑦 = |14.3−9.8| 9.8 % 𝑒𝑟𝑟𝑜𝑟𝐺𝑟𝑎𝑣𝑖𝑡𝑦 = |4.5| 9.8 × 100% × 100% × 100% % 𝑒𝑟𝑟𝑜𝑟𝐺𝑟𝑎𝑣𝑖𝑡𝑦 = 0. 459183673 × 100% % 𝑒𝑟𝑟𝑜𝑟𝐺𝑟𝑎𝑣𝑖𝑡𝑦 = 45. 9% a. Are your results in excellent (< 1%), good (1 − 5%), fair (5 − 10%), or poor (> 10%) agreement with the accepted value? Our result for the power to which h is raised to was in fair agreement with the accepted value (5-10%), but our result for the gravitational field strength had poor agreement with the accepted value (>10%). Name: Date: 11. If you had to perform this experiment in the real world, what potential source of uncertainty do you think would be the most important to focus on when designing and implementing the lab? Explain your answer. Had we done this experiment in the real world, I think that the greatest source of uncertainty would have been air resistance, as having a varying acceleration in the x direction would make the range vary significantly, and approach a limit, as air resistance would be the only force acting on the object in the horizontal plane, slowing down the object. Conclusion 12. Are the results of your experimental data consistent with the concepts and equations outlined in your theory section? Explain your answer by referring to specific measured or calculated values, and graphical trends you observed in the analysis of the data. The results of our experimental data were generally consistent with the concepts and equations outlined in the theory section. our calculated value for the power of h was 0.46, which is relatively close to ½ (Fair agreement, 5-10%), and our calculated value for gravitational field strength was 14.3 m/s2 [down], which is relatively in line with the expected strength of 9.80m/s2 [down], despite having an error of 45.9%. Additionally, we expected our relationship to be quadratic, and this can be confirmed by the relatively linear nature of our log-log plot, meaning the original relationship must have been quadratic. Marking Scheme: Inquiry - /23 #2 o Communication - Correct Formula o o Correct Formula o o /2 o o o o #5 Trend described Slope expression (𝑚 =...) (2) Constant term expression ( 𝑏 = …) (2) 𝑔 expression o o #4 Assumptions States assumptions x 0.5 Describes assumptions x 0.5 /3 o o o #6 Completed table o o #7 Formatting (4) Fitted data (2) o o o o o #8 Estimation of exponent o #9 Estimation of 𝑔 - - - - - - - /6 - /1 - /1 #12 Agreement? Cites measured value (ex. 𝑔) Describes graphical trends and agreement with predictions Improvements? /3 /4 - #11 States significant source Describes/explains impact /2 - /7 - Determines percentage error (2) Agreement? /4 - /8 #10 /2 - #3 Application Identifies components of the projectile motion /2 - /6 #1


