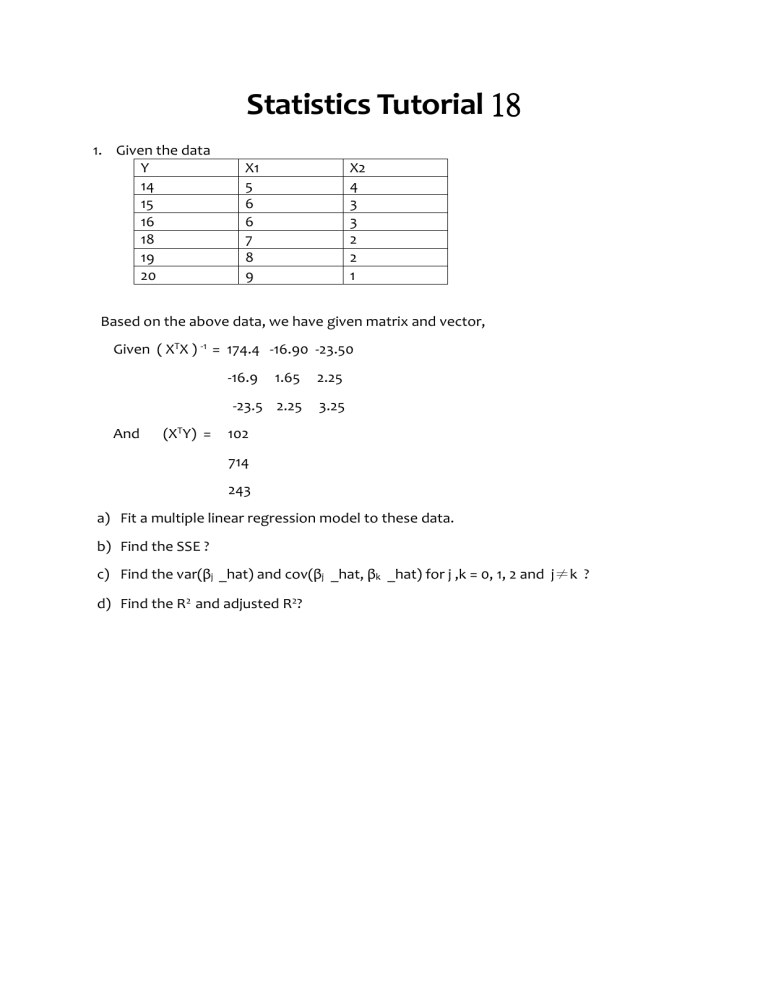
Statistics Tutorial 18 1. Given the data Y 14 15 16 18 19 20 X1 5 6 6 7 8 9 X2 4 3 3 2 2 1 Based on the above data, we have given matrix and vector, Given ( XTX ) -1 = 174.4 -16.90 -23.50 -16.9 And (XTY) = 1.65 2.25 -23.5 2.25 3.25 102 714 243 a) Fit a multiple linear regression model to these data. b) Find the SSE ? c) Find the var(βj _hat) and cov(βj _hat, βk _hat) for j ,k = 0, 1, 2 and j≠k ? d) Find the R2 and adjusted R2? 2. a) Compute the 2-way Anova and interpret the result? b) Is there evidence of an interaction effect? Use α = 0.05. c) Also draw an interaction plot to see if there evidence of an interaction effect 2


