Rocks, Minerals & Exploitation Worksheet: Data Analysis & Graphs
advertisement
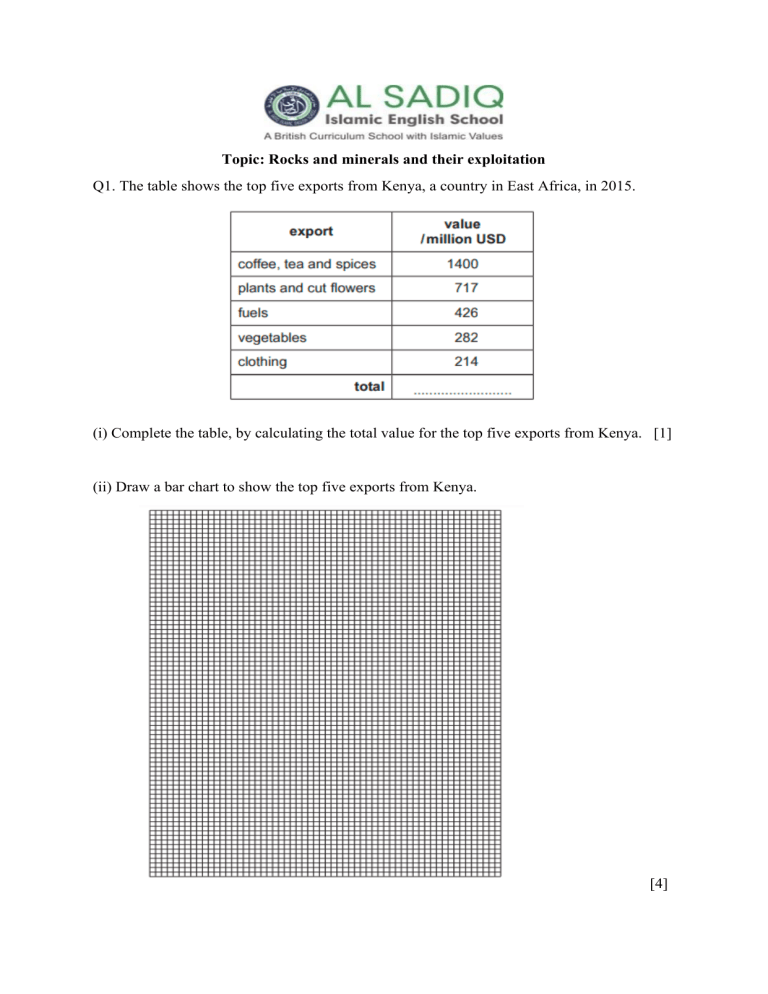
Topic: Rocks and minerals and their exploitation Q1. The table shows the top five exports from Kenya, a country in East Africa, in 2015. (i) Complete the table, by calculating the total value for the top five exports from Kenya. [1] (ii) Draw a bar chart to show the top five exports from Kenya. [4] Q2.Bulgaria is a country in Europe. The graph shows the population of Bulgaria between 1890 and 2015. The graph is incomplete. (a) (i) Complete the graph using the information in the table. (ii) Describe the trends in the population of Bulgaria between 1890 and 2015. ........................................................................................................................................... ........................................................................................................................................... ........................................................................................................................................... .......................................................................................................................................... [2] Q3 Calcium is an important mineral needed for growth. A student investigated how calcium affects the growth of giant land snails. One group of giant land snails were fed leaves only (diet A). A second group of giant land snails were fed leaves with calcium added (diet B). The student measured the shell length of each giant land snail at four-week intervals. The table shows the results. (i) Plot a line graph of the data for diet A and diet B. [4] (ii) On the graph, draw a straight line between each plotted point for diet A and another straight line between each plotted point for diet B. Label the lines A and B. Q4. The pie chart shows the percentage electricity consumption for different sectors in Iceland for 2013. [1] (i) Use the table to complete the pie chart and the key [2] (b) The table shows the reasons for deforestation in Indonesia (ii) Complete the pie chart to show the reasons for deforestation in Indonesia. Use the key provided. [4] Q5The bar chart shows the mass of waste that goes to landfill or is recycled in one Australian state (ii) Determine which type of waste has the greatest total mass. ..................................................................................................................................... [1] (iii) The ratio of landfill to recycled waste for garden waste is 3.5 : 6. Determine which type of waste has the greatest proportion that is recycled. .......................................................... [1]
